 Global| Nov 27 2013
U.S. Initial Unemployment Claims Fall Further
by:Sandy Batten
|in:Economy in Brief
Summary
After an outsize decline in the previous week, seasonally adjusted initial unemployment claims belied market expectations in the week ending November 23, falling 10,000 to 316,000. The market consensus had looked for a modest rebound [...]
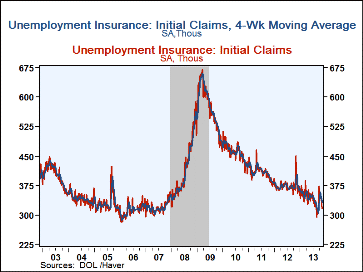
After an outsize decline in the previous week, seasonally adjusted initial unemployment claims belied market expectations in the week ending November 23, falling 10,000 to 316,000. The market consensus had looked for a modest rebound to 330,000. The November 16 reading was revised slightly higher (+3,000). Claims have fallen 57,000 since early October, and in the most recent week, the four-week average of claims fell nearly 8,000 to 331,750, its lowest reading since October 5.
While these figures would seem to point to a rather significant improvement in labor market conditions, the weekly figures need to be interpreted with some caution. As the Labor Department has noted, in the past two months, claims have been affected by computer problems in California and the federal government shutdown. Moreover, as we approach the Christmas holiday season, claims are entering a period during which it is very difficult to accurately seasonally adjust weekly data. Indeed, this week’s report may have reflected seasonal adjustment issues as Thanksgiving usually appears in the week report today. However, this year, Thanksgiving is the latest it can possibly be, occurring in the last week of November.
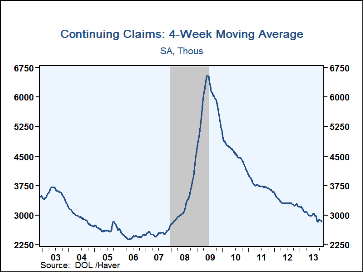
Nonetheless, declines in weekly claims, the four-week average, and importantly, continuing claims (which fell 91,000 to 2.776 million in the week ended November 16, latest available data and a new low for this expansion) indicate that labor market conditions have clearly improved, though the extent of the improvement may be difficult to calibrate.
Data on weekly unemployment insurance are contained in Haver's WEEKLY database and they are summarized monthly in USECON. Data for individual states are in REGIONW. The consensus estimates come from the Action Economics survey, carried in the AS1REPNA database.
| Unemployment Insurance (000s) | 11/23/13 | 11/16/13 | 11/09/13 | Y/Y % | 2012 | 2011 | 2010 |
|---|---|---|---|---|---|---|---|
| Initial Claims | 316 | 326 | 344 | -18.5 | 375 | 409 | 459 |
| Continuing Claims | -- | 2,776 | 2,867 | -15.1 | 3,319 | 3,742 | 4,531 |
| Insured Unemployment Rate (%) | -- | 2.1 | 2.2 | 2.6 (11/12) |
2.6 | 3.0 | 3.6 |
| Total "All Programs" (NSA) | -- | -- | 3.913 mil. | -24.5 | 6.049 mil. | 7.724 mil. | 9.825 mil. |
Sandy Batten
AuthorMore in Author Profile »Sandy Batten has more than 30 years of experience analyzing industrial economies and financial markets and a wide range of experience across the financial services sector, government, and academia. Before joining Haver Analytics, Sandy was a Vice President and Senior Economist at Citibank; Senior Credit Market Analyst at CDC Investment Management, Managing Director at Bear Stearns, and Executive Director at JPMorgan. In 2008, Sandy was named the most accurate US forecaster by the National Association for Business Economics. He is a member of the New York Forecasters Club, NABE, and the American Economic Association. Prior to his time in the financial services sector, Sandy was a Research Officer at the Federal Reserve Bank of St. Louis, Senior Staff Economist on the President’s Council of Economic Advisors, Deputy Assistant Secretary for Economic Policy at the US Treasury, and Economist at the International Monetary Fund. Sandy has taught economics at St. Louis University, Denison University, and Muskingun College. He has published numerous peer-reviewed articles in a wide range of academic publications. He has a B.A. in economics from the University of Richmond and a M.A. and Ph.D. in economics from The Ohio State University.
More Economy in Brief
 Global| Feb 05 2026
Charts of the Week: Balanced Policy, Resilient Data and AI Narratives
by:Andrew Cates


