 Global| Feb 04 2010
U.S. Initial Jobless InsuranceClaims Inch Up
by:Tom Moeller
|in:Economy in Brief
Summary
The Labor Department reported that initial claims for jobless insurance last week made up the prior period's decline with a gain to 480,000. Despite the increase, claims remained near the lowest level since late August, 2008 and were [...]
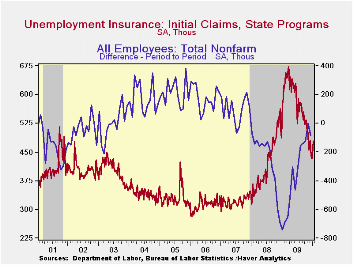 The Labor Department reported that initial claims for jobless
insurance last week made up the prior period's decline with a gain to
480,000. Despite the increase, claims remained near the lowest level
since late August, 2008 and were down from the recession peak of
674,000 hit last March. Consensus expectations had been for 454,000
claims. The weekly gains raised the four-week moving average of initial
claims to 468,750 which remained near the cycle low.
The Labor Department reported that initial claims for jobless
insurance last week made up the prior period's decline with a gain to
480,000. Despite the increase, claims remained near the lowest level
since late August, 2008 and were down from the recession peak of
674,000 hit last March. Consensus expectations had been for 454,000
claims. The weekly gains raised the four-week moving average of initial
claims to 468,750 which remained near the cycle low.
Continuing claims for unemployment insurance during the latest week held roughly steady at the cycle low. The 2,000 weekly uptick left claims down by one-third since late-June. Continuing claims were at the lowest level since mid-January of last year. The overall decline is a function of the improved job market but also reflects the exhaustion of 26 weeks of unemployment benefits. Continuing claims provide an indication of workers' ability to find employment. The four-week average of continuing claims fell to a cycle low of 4,617,500. This series dates back to 1966.
Extended benefits for unemployment insurance slipped to another cycle low of 222,833 during the third week of January and were down by two-thirds from a peak of 597,688 reached in November.
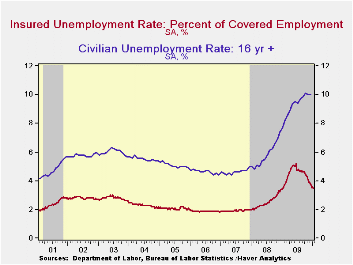
The insured rate of unemployment remained stable at a low of 3.5%. The rate reached a high of 5.2% during late-June. During the last ten years, there has been a 93% correlation between the level of the insured unemployment rate and the overall rate of unemployment published by the Bureau of Labor Statistics.
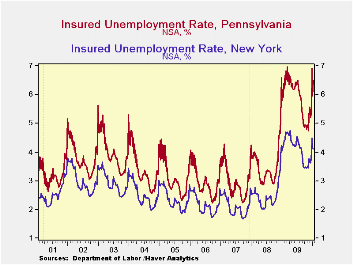
The highest insured unemployment rates in the week ending January 15 were in Alaska (7.3), Pennsylvania (6.5), Wisconsin (6.4 percent), Montana (6.2), Michigan (6.0), North Carolina (5.3), Washington (5.3) and Connecticut (5.3). The lowest insured unemployment rates were in Virginia (2.3), Texas (2.5), Florida (3.4), Maryland (3.7), Mississippi (3.8), Wyoming (3.8), Ohio (3.9), New York (4.1) and Maine (4.3). These data are not seasonally adjusted but the overall insured unemployment rate is.
The unemployment insurance claims data is available in Haver's WEEKLY database and the state data is in the REGIONW database.
| Unemployment Insurance (000s) | 1/30/10 | 1/23/10 | 1/16/10 | Y/Y | 2009 | 2008 | 2007 |
|---|---|---|---|---|---|---|---|
| Initial Claims | 480 | 472 | 479 | -23.1% | 573 | 419 | 321 |
| Continuing Claims | -- | 4,602 | 4,600 | -3.1% | 5,835 | 3,345 | 2,552 |
| Insured Unemployment Rate (%) | -- | 3.5 | 3.5 | 3.5 (1/2009) | 4.4 | 2.5 | 1.9 |
by Tom Moeller February 4, 2010
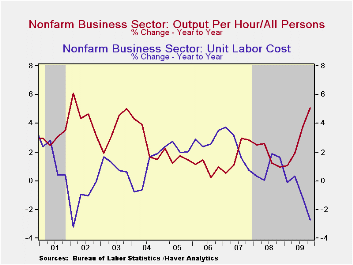 Worker
productivity surged during the fourth quarter. Employers kept a tight
hold on costs as the economic recovery began to take hold. The 6.2%
(AR) jump in 4Q productivity followed a downwardly revised 7.2% 3Q gain
but it pulled growth for the full year up to 3.0%, the fastest since
2003. A 6.0% gain in 4Q productivity was the Consensus
expectation.
Worker
productivity surged during the fourth quarter. Employers kept a tight
hold on costs as the economic recovery began to take hold. The 6.2%
(AR) jump in 4Q productivity followed a downwardly revised 7.2% 3Q gain
but it pulled growth for the full year up to 3.0%, the fastest since
2003. A 6.0% gain in 4Q productivity was the Consensus
expectation.
The rise in productivity came as output jumped
7.2%. The gain was an acceleration from 2.3% growth during 3Q but it
nevertheless left full-year output down 3.6% Hours-worked
(employment times hours) rose 1.0% but for the year fell 6.4% as a
tight rein on costs was kept. Growth in compensation costs
decelerated sharply from 3Q. The 1.5% gain was the slowest since a 1Q
 decline and
the 2.0% rise was the slowest since 1994.
decline and
the 2.0% rise was the slowest since 1994.
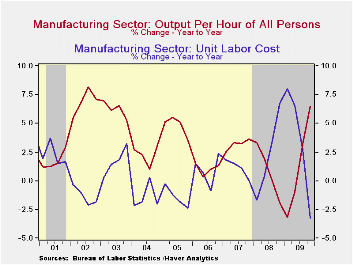
Stronger productivity and weaker compensation growth pulled 4Q unit labor costs down 4.4%. Except for a slightly greater decline during 1Q, it was the sharpest decline since 2002 and it was enough to pull costs down 0.9% for the year, the first decline since 2002.
The surge in 4Q worker productivity growth reflected vibrancy in the factory sector where employers held a notably tight rein on costs. Productivity gained 7.8% following an upwardly revised 14.4% 3Q jump. For the year, productivity rose 1.4% after a 0.8% rise during 2008. Recent gains have been prompted by quarterly output growth which turned sharply positive by 3Q and continued up at a 6.1% annual rate at yearend. Nevertheless, output fell 11.0% for the year. Hours worked similarly fell but by lesser amounts. Compensation slipped 0.2% but the 4.8% gain earned was the fastest since 2003. Strong productivity and gains in compensation combined to lower unit labor costs by 7.4%, about the same as during 3Q but for the year unit costs rose 3.4%, the strongest rise since 2000.
The productivity & cost figures are available in Haver's USECON database.
| Nonfarm Business Sector (SAAR,%) | 4Q '09 | 3Q '09 | 2Q '09 | 4Q Y/Y | 2009 | 2008 | 2007 |
|---|---|---|---|---|---|---|---|
| Output per Hour | 6.2 | 7.2 | 6.9 | 5.1 | 3.0 | 1.8 | 1.9 |
| Compensation per Hour | 1.5 | 5.6 | 6.8 | 2.2 | 2.0 | 2.8 | 4.2 |
| Unit Labor Costs | -4.4 | -1.5 | 0.0 | -2.8 | -0.9 | 1.0 | 2.3 |
| Manufacturing Sector | |||||||
| Output per Hour | 7.8 | 14.4 | 6.8 | 6.5 | 1.4 | 0.8 | 3.2 |
| Compensation per Hour | -0.2 | 6.5 | 6.5 | 3.0 | 4.8 | 3.0 | 4.3 |
| Unit Labor Costs | -7.4 | -7.0 | -0.3 | -3.2 | 3.4 | 2.2 | 1.1 |
by Robert Brusca February 4, 2010
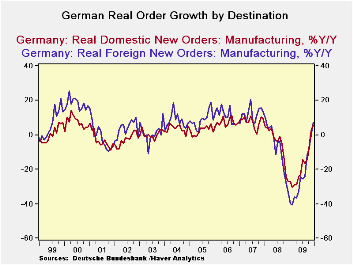
German Industrial orders are still rising Yr/Yr but they took a steep fall in December dropping by 2.3%. Foreign orders led the way lower falling by 3.2% with domestic-sourced orders off by just 1.4% Overall MFG sales also fell in December dropping at a 2% month-to-month pace.
With the December drop in place, orders are now decelerating over three-months compared to six months. The progression of accelerating growth rates has been interrupted. Foreign orders are responsible for this backtracking as domestic orders are still advancing over three months and surpassing their six month growth results
The report was a shock to markets. On a day in which Greeks are starting to bristle and strike to avoid the pain of their self-imposed austerity plan and stock markets in debt-ladened EMU countries are being bashed it is a ‘fitting’ piece of bad news.
| German Orders and Sales By Sector and Origin | ||||||||
|---|---|---|---|---|---|---|---|---|
| Real and SA | % M/M | % Saar | ||||||
| Dec-09 | Nov-09 | Oct-09 | 3-MO | 6-Mo | 12-Mo | YrAgo | QTR-2-Date | |
| Total Orders | -2.3% | 2.7% | -1.7% | -5.5% | -2.8% | 6.4% | -30.5% | 2.6% |
| Foreign | -3.2% | 3.6% | -3.3% | -11.3% | -5.8% | 7.2% | -33.2% | 10.1% |
| Domestic | -1.4% | 1.6% | 0.3% | 2.2% | 1.1% | 5.5% | -27.1% | -5.0% |
| Real Sector Sales | ||||||||
| MFG/Mining | -2.0% | 0.1% | -0.4% | -8.9% | -4.6% | -5.7% | -12.6% | 3.2% |
| Consumer | 2.4% | 2.0% | -0.2% | 18.1% | 8.7% | -4.2% | -2.8% | 7.4% |
| Cons Durables | 0.2% | 3.2% | 2.2% | 24.8% | 11.7% | -4.4% | -13.3% | 18.5% |
| Cons Non-Durable | 2.8% | 1.9% | -0.6% | 17.3% | 8.3% | -4.1% | -0.9% | 5.8% |
| Captial Gds | -3.1% | 0.4% | -3.3% | -21.8% | -11.5% | -9.2% | -15.4% | -2.0% |
| Intermediate Gds | -2.9% | -0.5% | 3.2% | -1.2% | -0.6% | 0.0% | -16.1% | 11.0% |
| All MFG-Sales | -2.0% | 0.3% | -0.5% | -8.5% | -4.4% | -5.6% | -12.7% | 3.3% |
by Tom Moeller February 4, 2010
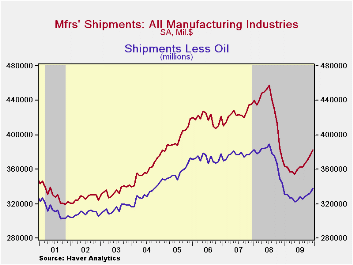 actory
shipments surged for the fourth straight month during December. The
1.9% increase followed an upwardly revised 1.6% November gain
and it was the fourth straight month of strong increase. Shipments of
nondurables were strong all during 2009 (9.3% y/y) due to the rise in
oil prices. Excluding oil, factory shipments rose 0.9% y/y, still an
improvement from the 11.9% y/y decline as of July. Shipments
of electrical equipment (-8.4% y/y) were strong for the third
consecutive month. Machinery shipments jumped 5.1% (-16.1% y/y) and
have risen sharply in three of the last four periods. Primary metals
shipments (+2.2% y/y) increased notably during 2H '09 and furniture
shipments (-10.0% y/y) have risen for three months.
actory
shipments surged for the fourth straight month during December. The
1.9% increase followed an upwardly revised 1.6% November gain
and it was the fourth straight month of strong increase. Shipments of
nondurables were strong all during 2009 (9.3% y/y) due to the rise in
oil prices. Excluding oil, factory shipments rose 0.9% y/y, still an
improvement from the 11.9% y/y decline as of July. Shipments
of electrical equipment (-8.4% y/y) were strong for the third
consecutive month. Machinery shipments jumped 5.1% (-16.1% y/y) and
have risen sharply in three of the last four periods. Primary metals
shipments (+2.2% y/y) increased notably during 2H '09 and furniture
shipments (-10.0% y/y) have risen for three months.
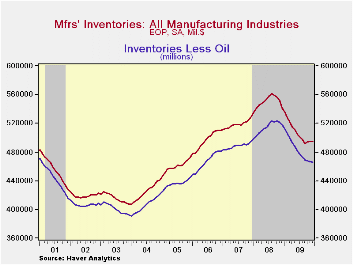
Though factory
inventories slipped 0.1% in December that followed much larger declines
extending back to September of 2008. The latest monthly drop came
despite a 3.9% jump (-22.1% y/y) in auto inventories which was the
 third
consecutive strong monthly gain. Elsewhere, petroleum inventories
jumped 4.2% (25.8% y/y) due to higher prices. Excluding oil, factory
inventories slipped 0.3% (-10.2% y/y). Machinery inventories slipped
(-13.4% y/y) but that compares to large declines which extend through
most of last year. Electrical equipment inventories slipped 0.5%
(-17.7% y/y) but the monthly rates of decline also have
slowed considerably. Inventories of computers & electronic
products rose 0.7% (-9.5% y/y) for the first monthly gain in twelve
months.
third
consecutive strong monthly gain. Elsewhere, petroleum inventories
jumped 4.2% (25.8% y/y) due to higher prices. Excluding oil, factory
inventories slipped 0.3% (-10.2% y/y). Machinery inventories slipped
(-13.4% y/y) but that compares to large declines which extend through
most of last year. Electrical equipment inventories slipped 0.5%
(-17.7% y/y) but the monthly rates of decline also have
slowed considerably. Inventories of computers & electronic
products rose 0.7% (-9.5% y/y) for the first monthly gain in twelve
months.
Factory orders rose 1.0% for the second consecutive month but that rise also was lifted by higher oil prices. Less oil (where orders equal shipments), orders rose 0.7% (-1.0% y/y) and have risen for four consecutive months. Orders for primary metals have been notably strong (16.9% y/y) as have machinery orders where the 0.1% y/y decline compares to one-third drops early in 2008.The decline in electrical equipment orders has moderated to 7.4% from -30.3% as of June.
The Manufacturers' Shipments, Inventories and Orders (MSIO) data are available in Haver's USECON database.
| Factory Survey (NAICS, %) | December | November | October | Y/Y | 2009 | 2008 | 2007 |
|---|---|---|---|---|---|---|---|
| Inventories | -0.1 | 0.2 | 0.4 | -8.6 | -8.6 | 2.2 | 3.7 |
| Excluding Transportation | -0.0 | 0.3 | 0.3 | -9.2 | -9.2 | -0.5 | 2.7 |
| New Orders | 1.0 | 1.0 | 0.8 | 3.6 | -17.2 | 0.0 | 1.9 |
| Excluding Transportation | 1.2 | 2.1 | 0.7 | 5.8 | -15.8 | 3.0 | 1.2 |
| Shipments | 1.9 | 1.6 | 0.9 | 2.6 | -15.2 | 1.6 | 1.2 |
| Excluding Transportation | 1.6 | 1.7 | 1.6 | 3.1 | -15.3 | 3.5 | 1.5 |
| Unfilled Orders | -1.0 | -0.7 | -0.6 | -10.3 | -10.3 | 3.4 | 17.1 |
| Excluding Transportation | 0.2 | 0.2 | -0.1 | -8.6 | -8.6 | -1.4 | 8.2 |

Tom Moeller
AuthorMore in Author Profile »Prior to joining Haver Analytics in 2000, Mr. Moeller worked as the Economist at Chancellor Capital Management from 1985 to 1999. There, he developed comprehensive economic forecasts and interpreted economic data for equity and fixed income portfolio managers. Also at Chancellor, Mr. Moeller worked as an equity analyst and was responsible for researching and rating companies in the economically sensitive automobile and housing industries for investment in Chancellor’s equity portfolio. Prior to joining Chancellor, Mr. Moeller was an Economist at Citibank from 1979 to 1984. He also analyzed pricing behavior in the metals industry for the Council on Wage and Price Stability in Washington, D.C. In 1999, Mr. Moeller received the award for most accurate forecast from the Forecasters' Club of New York. From 1990 to 1992 he was President of the New York Association for Business Economists. Mr. Moeller earned an M.B.A. in Finance from Fordham University, where he graduated in 1987. He holds a Bachelor of Arts in Economics from George Washington University.
More Economy in Brief


