 Global| Jun 11 2009
U.S. Initial Jobless Insurance Claims Fall To Their Lowest Since January
by:Tom Moeller
|in:Economy in Brief
Summary
At the margin, the labor market continues to show signs of firming ... but just a bit. The latest indication is that last week, initial claims for unemployment insurance fell a sharp 24,000 to 601,000 from a little revised 625,000 [...]
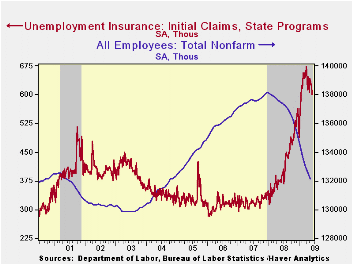
At the margin, the labor market continues to show signs of
firming ... but just a bit. The latest indication is that last week,
initial claims for unemployment insurance fell a sharp 24,000 to
601,000 from a little revised 625,000 during the prior two weeks.
Initial claims are down from their March peak of 674,000. Moreover, the
four-week average of claims, which smoothes out some of the volatility
in the weekly numbers, fell to 621,750 which was its lowest level since
since mid-February. Still, the level remained up by two-thirds from the
year ago level. The Consensus expectation was for 615,000 claims last
week.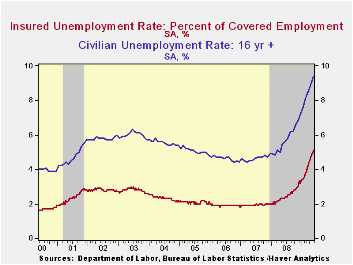
The Labor Department indicated that the largest increases in initial claims for the week ending May 30 were in Connecticut (+816), Louisiana (+809), Tennessee (+672), Arizona (+618), and Nebraska (+576), while the largest decreases were in Florida (-6,655), Illinois (-4,496), Michigan (-4,385), California (-3,551), and Texas (-2,886).
Despite the indication of fewer jobs lost, new job creation remains under pressure. Continuing claims for unemployment insurance, which provide an indication of workers' ability to find employment, rose to another record high of 6,816,000, more than twice the year ago level. Further indicating that the job market remains weak, the four-week average of continuing claims also rose to another record of 6,750,500. The series dates back to 1966.
Further indicating the labor market's softness was that the insured unemployment rate held at 5.1% for the second consecutive week. That level was more than double last May and the highest level since 1983. During the last ten years there has been a 93% correlation between the level of the insured unemployment rate and the overall rate of unemployment published by the Bureau of Labor Statistics.Clearly, the latest weekly figure understates labor market distress in some states.
The highest insured unemployment rates in the week ending May 23 were in Michigan (7.2 percent), Oregon (6.9), Puerto Rico (6.4), Nevada (6.3), Pennsylvania (6.2), Wisconsin (5.8), Arkansas (5.4), North Carolina (5.4), Illinois (5.3), and South Carolina (5.3).
The unemployment insurance claims data is available in Haver's WEEKLY database and the state data is in the REGIONW database.
| Unemployment Insurance (000s) | 06/06/09 | 05/30/09 | 05/23/09 | Y/Y | 2008 | 2007 | 2006 |
|---|---|---|---|---|---|---|---|
| Initial Claims | 601 | 625 | 625 | 54.9% | 420 | 321 | 313 |
| Continuing Claims | -- | 6,816 | 6,757 | 117.6% | 3,342 | 2,552 | 2,459 |
by Tom Moeller June 11, 2009
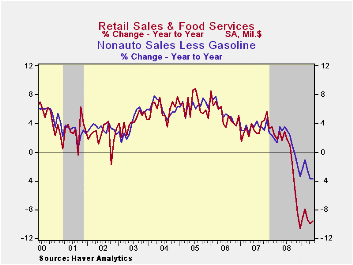
Despite the latest increase in overall retail sales, U.S. consumer spending remains constrained by weak job growth and rising gasoline prices. The restraint was evident in a modest, expected 0.5% increase in May retail sales which followed a little-revised 0.2% decline during April. Highlighting the stress on spending was the magnitude of the year-to-year drop in retail sales. They are off 9.6% in the twelve months ended in May, nearly the sharpest shortfall on record. Consumers remain disinclined to shift the dollars saved because of lower gasoline prices versus last summer. The retail sales data are available in Haver's USECON database.
Much of the gain in retail spending last month owed to a 3.6%
rise (-33.8% y/y) in sales of gasoline service stations. That gain was
certainly powered by the 10.6% (NSA) rise in the retail price for a
gallon of gasoline. In addition, mirroring the earlier report of higher
May unit sales of motor vehicle sales, retail vehicle sales rose 0.5%
and made up the April decline. The slight dollar gain lagged the 6.4%
rise last month in unit vehicle sales, but both indicate flat sales
over the last two months.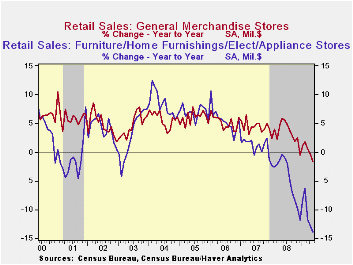
Emphasizing a persistent weakness in underlying consumer spending were retail sales excluding both autos and gasoline. They ticked up just 0.1% last month following a 0.1% dip during April. The best that can be said about consumption is that the earlier downward momentum in sales may have stabilized. These sales have risen at a 2.7% annual rate since December following last year's 2.8% decline from December-to-December last year.
Detail of the report show was just how weak discretionary spending remains. Sales at furniture, electronics & appliance stores fell another 0.5% (-13.9% y/y) following the 1.0% drop during April. So far this year these sales have fallen at a 7.1% annual rate after last year's 4.5% decline. Furniture store sales alone ticked down 0.4% (-14.7% y/y) while sales of electronics & appliances slipped 0.5% (-13.0% y/y). In the soft goods area, May apparel store sales rose by 0.4% (-7.0% y/y) following a 0.7% decline during April. Also restrained were sales at general merchandise stores during the last three months. Last month they fell 0.2% (-1.7% y/y) for the third consecutive monthly slip.
Not only are folks not visiting the stores, but they're not spending freely when at home. Lower internet and catalogue purchases pulled sales of non-store retailers down last month by another 0.4% (-7.1% y/y) and they have fallen slightly since December. Bucking the overall trend in spending, consumers continue to dine out. Restaurant sales rose just slightly last month but so far this year they have risen at a 5.3% annual rate (1.2% y/y).
Building materials sales increased all of 1.3% last month but they still are down by 10.3% from last May.
The Fed's latest Beige Book covering regional U.S. economic conditions can be found here.
| May | April | March | Y/Y | 2008 | 2007 | 2006 | |
|---|---|---|---|---|---|---|---|
| Retail Sales & Food Services (%) | 0.5 | -0.2 | -1.2 | -9.6 | -0.7 | 3.3 | 5.3 |
| Excluding Autos | 0.5 | -0.2 | -1.1 | -7.3 | 2.5 | 3.9 | 6.3 |
| Less Gasoline | 0.1 | -0.1 | -0.9 | -3.1 | 1.6 | 3.6 | 5.7 |
by Tom Moeller June 11, 2009
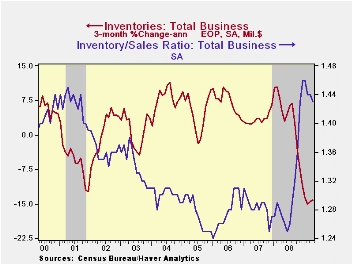
As worried as they are about the sales environment, businesses have taken the practice of shedding their inventories at the fastest rate in nearly thirty years. Total business inventories fell another 1.1% during April, down for the eighth straight month. These declines have given rise to a three-month decumulation rate of 14.1%. That is near the strongest in the series' history which dates back to 1980. The recent cutback in inventories is in reaction to an 8.3% rate of decline in business sales, though that rate of decline has eased a bit lately.
The troubling factor behind this equation is that the strong
inventory cutbacks have done little to reduce the inventory/sales ratio
which, at 1.43, was near its highest level since the recession of 2001.
Emphasizing the magnitude of the inventory back-up is the increase in
the I/S ratio during the last year, which is the swiftest since 1982
and it's still near its high. The rise ended a twenty-eight year
downtrend.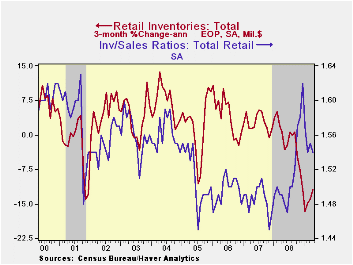
Retailers cut inventories by 1.0% in April and at an 11.9% annual rate during the last three months, nearly the fastest in the series' history. Motor vehicle inventories continued to lead the decumulation and fell at a 26.6% rate during the last three months. Recent inventory cutbacks, along with some stabilization of sales, finally is working to lower the inventory-to-sales ratio for automobiles to where it was during the Spring of 2008.
Outside of autos, retailers continued to reduce the levels of unwanted products. Furniture, home furnishings & electronics inventories fell just slightly during April (9.7% y/y) but the rate of decline appears to be easing. Conversely, apparel retailers haven't backed off at all from their efforts to reduce unwanted inventory. Over the last three months they're down at a 12.7% annual rate, the swiftest on record. General merchandise inventories rejoined the trend toward reducing stores of unwanted products. Inventories fell 0.6% in April after a slight March increase and they're off at a 6.3% annual rate during the last three months. The cuts in inventory accumulation have gone some distance in reducing the inventory-to-sales ratio for the nonauto retail sector, but it still remained high.
The business sales and inventory data are available in Haver's USECON database.
The Systemic Importance of Consumer Protection is today's speech by Fed Governor Elizabeth A. Duke and it is available here.
Inventory Accelerator In General Equilibrium from the Federal Reserve Bank of St. Louis can be found here.
| Business Inventories (%) | April | March | February | Y/Y | 2008 | 2007 | 2006 |
|---|---|---|---|---|---|---|---|
| Total | -1.1 | -1.3 | -1.4 | -6.6 | 0.6 | 4.0 | 6.4 |
| Retail | -1.0 | -0.9 | -1.2 | -8.5 | -3.1 | 2.5 | 3.3 |
| Retail excl. Auto | -0.5 | -0.3 | -0.5 | -4.4 | -1.8 | 2.7 | 4.7 |
| Wholesale | -1.4 | -1.8 | -1.7 | -6.2 | 3.1 | 6.2 | 8.2 |
| Manufacturing | -1.0 | -1.2 | -1.3 | -5.1 | 2.1 | 3.7 | 8.2 |

Tom Moeller
AuthorMore in Author Profile »Prior to joining Haver Analytics in 2000, Mr. Moeller worked as the Economist at Chancellor Capital Management from 1985 to 1999. There, he developed comprehensive economic forecasts and interpreted economic data for equity and fixed income portfolio managers. Also at Chancellor, Mr. Moeller worked as an equity analyst and was responsible for researching and rating companies in the economically sensitive automobile and housing industries for investment in Chancellor’s equity portfolio. Prior to joining Chancellor, Mr. Moeller was an Economist at Citibank from 1979 to 1984. He also analyzed pricing behavior in the metals industry for the Council on Wage and Price Stability in Washington, D.C. In 1999, Mr. Moeller received the award for most accurate forecast from the Forecasters' Club of New York. From 1990 to 1992 he was President of the New York Association for Business Economists. Mr. Moeller earned an M.B.A. in Finance from Fordham University, where he graduated in 1987. He holds a Bachelor of Arts in Economics from George Washington University.
More Economy in Brief


