 Global| Jun 19 2008
U.S. Initial Claims for Unemployment Insurance Slipped
by:Tom Moeller
|in:Economy in Brief
Summary
Initial unemployment insurance claims slipped to 381,000 last week from a revised 386,000 during the prior week, which was revised up slightly. Consensus expectations had been for 375,000 claims. The latest figure covers the survey [...]
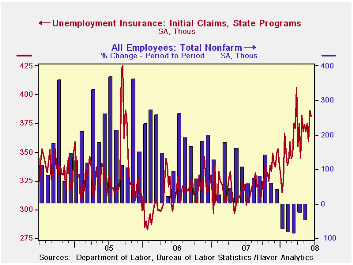
Initial unemployment insurance claims slipped to 381,000 last week from a revised 386,000 during the prior week, which was revised up slightly. Consensus expectations had been for 375,000 claims.
The latest figure covers the survey week for June nonfarm payrolls and claims were up 3.5% from the May survey period.
A claims level below 400,000 typically has been associated
with growth in nonfarm payrolls. During the last ten years there has
been a (negative) 76% correlation between the level of initial claims
and the m/m change in nonfarm payroll employment.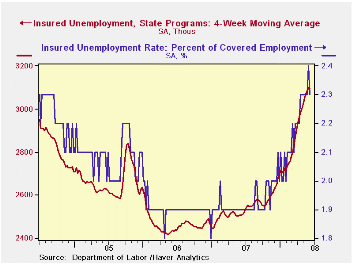
The four-week moving average of initial claims rose slightly week-to-week to 375,250 (19.2% y/y). Claims averaged 369,000 during May. The numbers compare to March when initial claims averaged 375,000.
Continuing claims for unemployment insurance fell 75,000 following a 28,000 worker decline during the prior week. That was revised from the initial report of a 58,000 increase. The four-week average of continuing claims fell slightly to 3,096,000.
Continuing claims provide some indication of workers' ability to find employment and they lag the initial claims figures by one week.
The insured rate of unemployment fell back to 2.3% after one week at 2.4%.
Retirement Savings and Decision Errors: Lessons from Behavioral Economics from the Federal Reserve Bank of San Francisco can be found here.
| Unemployment Insurance (000s) | 06/14/08 | 06/07/08 | Y/Y | 2007 | 2006 | 2005 |
|---|---|---|---|---|---|---|
| Initial Claims | 381 | 386 | 17.6% | 322 | 313 | 331 |
| Continuing Claims | -- | 3,060 | 21.6% | 2,552 | 2,459 | 2,662 |
by Tom Moeller June 19, 2008
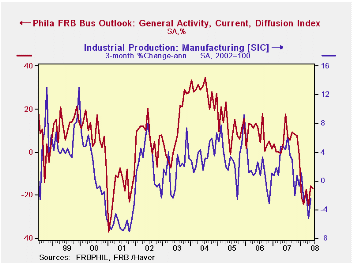
The Index of General Business conditions in the manufacturing sector for June, from the Philadelphia Federal Reserve Bank, slipped to -17.1 following improvement during May. A level of -10 had been expected.
The Philadelphia Fed constructs a diffusion index for total business activity and each of the sub indexes. The business conditions index reflects a separate survey question, not the sub-indexes.
During the last ten years there has been a 61% correlation
between the level of the Philadelphia Fed Business Conditions Index and
the three-month growth in factory sector industrial production. There
has been a 43% correlation with q/q growth in real GDP.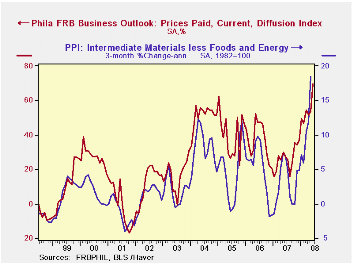
The new orders sub-index deteriorated sharply and lost half of the improvement during May. Shipments also fell sharply as did the employment index.
The prices paid index surged to the highest level since 1980. During the last ten years there has been a 67% correlation between the prices paid index and the three-month growth in the intermediate goods PPI. There has been an 82% correlation with the change in core intermediate goods prices.
The separate index of expected business conditions in six months fell in June to 21.2 from 28.2 in May. The level of index was still below the full-year, 2007 reading of 24.7. Expectations for the production, shipments and employment indexes all fell. Prices rose sharply.
The latest Business Outlook Survey from the Federal Reserve Bank of Philadelphia can be found here.
Liquidity Crises from the Federal Reserve Bank of Philadelphia is available here.
The Evolution of the World Income Distribution*, also from the Federal Reserve Bank of Philadelphia, can be found here.
| Philadelphia Fed (%) | June | May | June '07 | 2007 | 2006 | 2005 |
|---|---|---|---|---|---|---|
| General Activity Index | -17.1 | -15.6 | 17.7 | 5.1 | 8.1 | 11.5 |
| Prices Paid Index | 69.3 | 53.8 | 27.4 | 26.4 | 36.6 | 40.1 |
by Robert Brusca June 19, 2008

Retail sales surged by 4% in May marking the strongest gain in 22 years. Economists’ estimates had looked for sales to drop slightly. The gain has flummoxed observers who are not quite sure what to make of the new developing trend. The chart above shows that sales had been volatile but the sharp gain in May has created a new uptrend in sales trends. The jump in May has doubled the Yr/Yr growth rate for sales in one fell swoop.
The jump in retail sales is a tremendous conundrum for policy
since it is difficult to believe that we are at the dawn of a new
spending spree and it is difficult to reconcile the jump in spending
with past trends and current circumstances.
| UK Real and Nominal Retail Sales | |||||||
|---|---|---|---|---|---|---|---|
| Nominal | May-08 | Apr-08 | Mar-08 | 3-MO | 6-MO | 12-MO | YrAGo |
| Retail Total | 4.0% | 0.0% | -0.5% | 14.6% | 11.6% | 7.8% | 4.2% |
| Food Beverages & Tobacco | 4.2% | -0.4% | -0.2% | 14.9% | 12.5% | 8.8% | 4.7% |
| Clothing footwear | 8.8% | -2.1% | -3.3% | 12.8% | 14.5% | 8.4% | 1.7% |
| Real | |||||||
| Retail Ex auto | 3.4% | -0.3% | -0.3% | 11.9% | 10.3% | 8.1% | 3.7% |
by Robert Brusca June 19, 2008
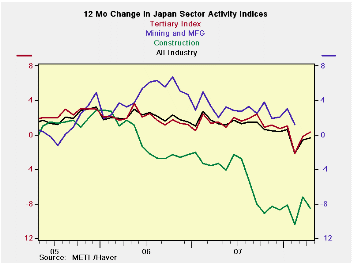
Japan’s all-industry index was up sharply in April and stands
in the 92nd percentile of its range of values since 1993. Construction
is about at weak as the all industry index is strong standing in the
bottom 2% of its range.
The all-industries index rose by 0.2 percent in April from its
year-earlier level following a 1.0 percent fall in March. The
all-industries index combines data from the primary sector (comprising
fishing, farming, forestry and mining) with the secondary or
manufacturing sector and data from the tertiary, or services, sector.
The services sector employs more than half of Japan's workforce.
Spending on services such as retailing, dining and travel drive this
sector. Its index stands in the 97th percentile of its range in April.
| Up to date Japan Industry Surveys | |||||||||
|---|---|---|---|---|---|---|---|---|---|
| Recent Months | Moving Averages | Extremes; Range | |||||||
| Apr-08 | Mar-08 | Feb-08 | 3-Mo | 6-Mo | 12-Mo | Max | Min | %-Tile | |
| All Industry | 107.0 | 106.2 | 105.9 | 106.4 | 106.9 | 107.2 | 108.1 | 93.8 | 92.3% |
| Construction | 72.0 | 72.5 | 70.7 | 71.7 | 72.1 | 74.2 | 124.6 | 70.7 | 2.4% |
| Tertiary | 110.4 | 108.5 | 108.5 | 109.1 | 109.7 | 110.0 | 110.9 | 92.0 | 97.4% |
| Ranges, Max, Min since 1993 | |||||||||

Tom Moeller
AuthorMore in Author Profile »Prior to joining Haver Analytics in 2000, Mr. Moeller worked as the Economist at Chancellor Capital Management from 1985 to 1999. There, he developed comprehensive economic forecasts and interpreted economic data for equity and fixed income portfolio managers. Also at Chancellor, Mr. Moeller worked as an equity analyst and was responsible for researching and rating companies in the economically sensitive automobile and housing industries for investment in Chancellor’s equity portfolio. Prior to joining Chancellor, Mr. Moeller was an Economist at Citibank from 1979 to 1984. He also analyzed pricing behavior in the metals industry for the Council on Wage and Price Stability in Washington, D.C. In 1999, Mr. Moeller received the award for most accurate forecast from the Forecasters' Club of New York. From 1990 to 1992 he was President of the New York Association for Business Economists. Mr. Moeller earned an M.B.A. in Finance from Fordham University, where he graduated in 1987. He holds a Bachelor of Arts in Economics from George Washington University.
More Economy in Brief


