 Global| Jul 16 2008
U.S. Industrial Production Up in June
by:Tom Moeller
|in:Economy in Brief
Summary
Industrial production recovered unexpectedly by 0.5% last month, but the gain was due mostly to warmer temperatures. The rise followed an unrevised 0.2% decline during May. Consensus expectations had been for no change in output last [...]
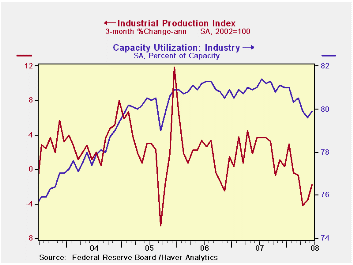
Industrial production recovered unexpectedly by 0.5% last month, but the gain was due mostly to warmer temperatures. The rise followed an unrevised 0.2% decline during May. Consensus expectations had been for no change in output last month.
Warmer temperatures lifted utility output by 2.1% during June and that offset the decline during May.
Factory output also was better than expected and rose 0.2% following an unrevised flat reading during May. The three-month rate change, however, remained negative at -3.1% (AR).
Production in the high tech sector again was firm and rose 1.8% (23.6% y/y). Production of computers & office equipment rose 0.8% (14.7% y/y) but the three-month growth rate slowed further to 3.7% (AR). Output of communications equipment jumped 1.6% and three-month growth totaled 18.4%.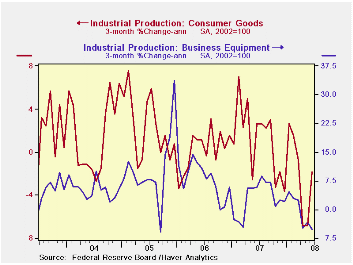
The trend in output outside the high-tech sector has been decidedly weak. Less high-tech, factory output rose all of 0.2% last month and three-month output growth remained a negative 4.1% (AR). Output of motor vehicles & parts did rise 5.4% in June but three-month growth was still low at -4.0%. June output of furniture fell 0.4% and at an 8.1% rate during the last three months. Electrical equipment rose at a 4.2% rate during the last three months. Machinery output continued to decline sharply at a 14.7% annual rate during the last three months.
In the nondurables area, output of apparel recovered 1.3% in June but it was still down at a 3.1% rate during the last three months.
Capacity utilization increased to 79.9% from an upwardly revised 79.6% during May. Utilization in the factory sector, however, was unchanged at 77.6%, near its lowest also since late-2004.
Speculative Bubbles and Overreaction to Technological Innovation from the Federal Reserve Bank of San Francisco can be found here.
| INDUSTRIAL PRODUCTION (SA) | June | May | Y/Y | 2007 | 2006 | 2005 |
|---|---|---|---|---|---|---|
| Total | 0.5 | -0.2 | 0.3 | 1.7 | 2.2 | 3.3 |
| Manufacturing | 0.2 | 0.0 | -0.6 | 1.7 | 2.4 | 4.0 |
| Consumer Goods | 0.8 | -0.2 | -0.8 | 1.7 | 0.3 | 2.8 |
| Business Equipment | 0.2 | 0.2 | 1.6 | 3.3 | 10.4 | 7.3 |
| Construction Supplies | -0.8 | 0.4 | -6.2 | -2.5 | 2.2 | 4.5 |
| Utilities | 2.1 | -2.1 | 4.0 | 3.3 | -0.6 | 2.1 |

Tom Moeller
AuthorMore in Author Profile »Prior to joining Haver Analytics in 2000, Mr. Moeller worked as the Economist at Chancellor Capital Management from 1985 to 1999. There, he developed comprehensive economic forecasts and interpreted economic data for equity and fixed income portfolio managers. Also at Chancellor, Mr. Moeller worked as an equity analyst and was responsible for researching and rating companies in the economically sensitive automobile and housing industries for investment in Chancellor’s equity portfolio. Prior to joining Chancellor, Mr. Moeller was an Economist at Citibank from 1979 to 1984. He also analyzed pricing behavior in the metals industry for the Council on Wage and Price Stability in Washington, D.C. In 1999, Mr. Moeller received the award for most accurate forecast from the Forecasters' Club of New York. From 1990 to 1992 he was President of the New York Association for Business Economists. Mr. Moeller earned an M.B.A. in Finance from Fordham University, where he graduated in 1987. He holds a Bachelor of Arts in Economics from George Washington University.
More Economy in Brief


