Global| Dec 15 2014
U.S. Industrial Production Surges by Most Since May 2010
by:Tom Moeller
|in:Economy in Brief
Summary
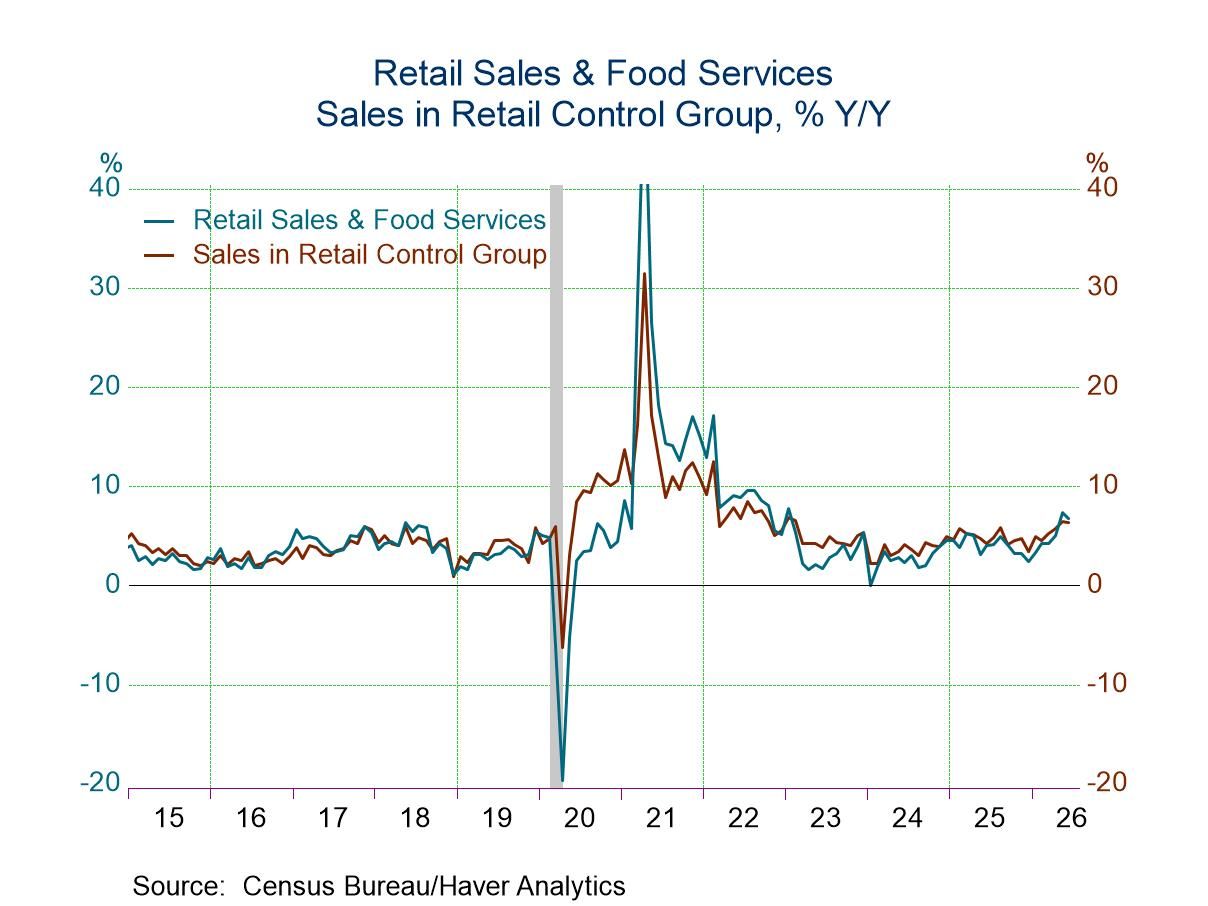
Industrial production jumped 1.3% last month (5.2% y/y) following a 0.1% uptick, revised from -0.1%. Manufacturing sector production surged 1.1% (4.7% y/y) following an upwardly revised 0.4% rise, last month reported as 0.2%. Three- [...]
Industrial production jumped 1.3% last month (5.2% y/y) following a 0.1% uptick, revised from -0.1%. Manufacturing sector production surged 1.1% (4.7% y/y) following an upwardly revised 0.4% rise, last month reported as 0.2%. Three-month growth in overall production surged to 9.5% (AR). A 0.7% gain in total production was expected in the Action Economics Forecast Survey.
Consumer goods production increased 2.5% (4.1% y/y) fueled by a 5.1% rise (7.7% y/y) in motor vehicles & parts which followed a 0.4% dip. Production of machinery gained 1.0% (8.2% y/y) after a 2.9% rise and electrical machinery output jumped 0.8% (2.9% y/y) and made up a 0.5% decline. Computer production rose 0.5% (5.5% y/y) following a 0.9% increase while furniture production remained unchanged (7.8% y/y) after a 0.4% rise. In the nondurable goods sector, apparel production jumped 2.3% (2.9% y/y) after no change and chemical production gained 0.9% (5.4% y/y) after a 0.7% rise. Textile production increased 0.8% (2.8% y/y), about the same as in October, and petroleum output improved 2.1% (4.5% y/y) after a 0.2% rise. Business equipment production rose 1.2% (6.5% y/y) following a 0.9% gain. Output of transit equipment increased 1.6% (5.8% y/y) after a 1.1% decline.
Within the special aggregate series, high technology industries posted a 1.1% production gain (7.1% y/y) following a 0.7% increase. It was helped by a 2.6% rise (0.4% y/y) in computers & office equipment after a 0.6% drop. Factory sector production excluding the high-tech sector rose 1.1% (4.7% y/y) following a 0.4% increase. Manufacturing production excluding both high-tech and autos improved 0.8% (4.5% y/y) after a 0.5% gain.
The capacity utilization rate increased to 80.1%, the high since 80.5% averaged in 2007. In the factory sector, the capacity utilization rate jumped to an expansion high of 79.2. Total industry capacity rose an improved 3.1% y/y while factory sector capacity increased 2.2% y/y.
Industrial production and capacity data are included in Haver's USECON database, with additional detail in the IP database. The expectations figure is in the AS1REPNA database.
Measuring and Financing Infrastructure Investments from the Federal Reserve Bank of Chicago can be found here https://www.chicagofed.org/publications/chicago-fed-letter/2015/331
| Industrial Production (SA, % Change) | Nov | Oct | Sep | Nov Y/Y | 2013 | 2012 | 2011 |
|---|---|---|---|---|---|---|---|
| Total Output | 1.3 | 0.1 | 0.9 | 5.2 | 2.9 | 3.8 | 3.3 |
| Manufacturing | 1.1 | 0.4 | 0.4 | 4.7 | 2.7 | 4.1 | 3.3 |
| Consumer Goods | 2.5 | 0.0 | 0.8 | 4.1 | 2.4 | 1.7 | 1.5 |
| Business Equipment | 1.2 | 0.9 | -0.3 | 6.5 | 3.6 | 7.5 | 5.6 |
| Construction Supplies | 0.6 | 0.2 | 0.6 | 4.7 | 4.2 | 4.6 | 3.0 |
| Materials | 0.8 | 0.0 | 1.1 | 6.1 | 3.2 | 4.5 | 4.7 |
| Utilities | 5.1 | -0.8 | 4.3 | 1.8 | 2.1 | -2.1 | -0.2 |
| Capacity Utilization (%) | 80.1 | 79.3 | 79.5 | 78.5 | 78.0 | 77.3 | 76.3 |
| Manufacturing | 78.4 | 77.6 | 77.4 | 76.4 | 76.1 | 75.5 | 73.9 |
U.S. Home Builders Index Slips
by Tom Moeller December 15, 2014
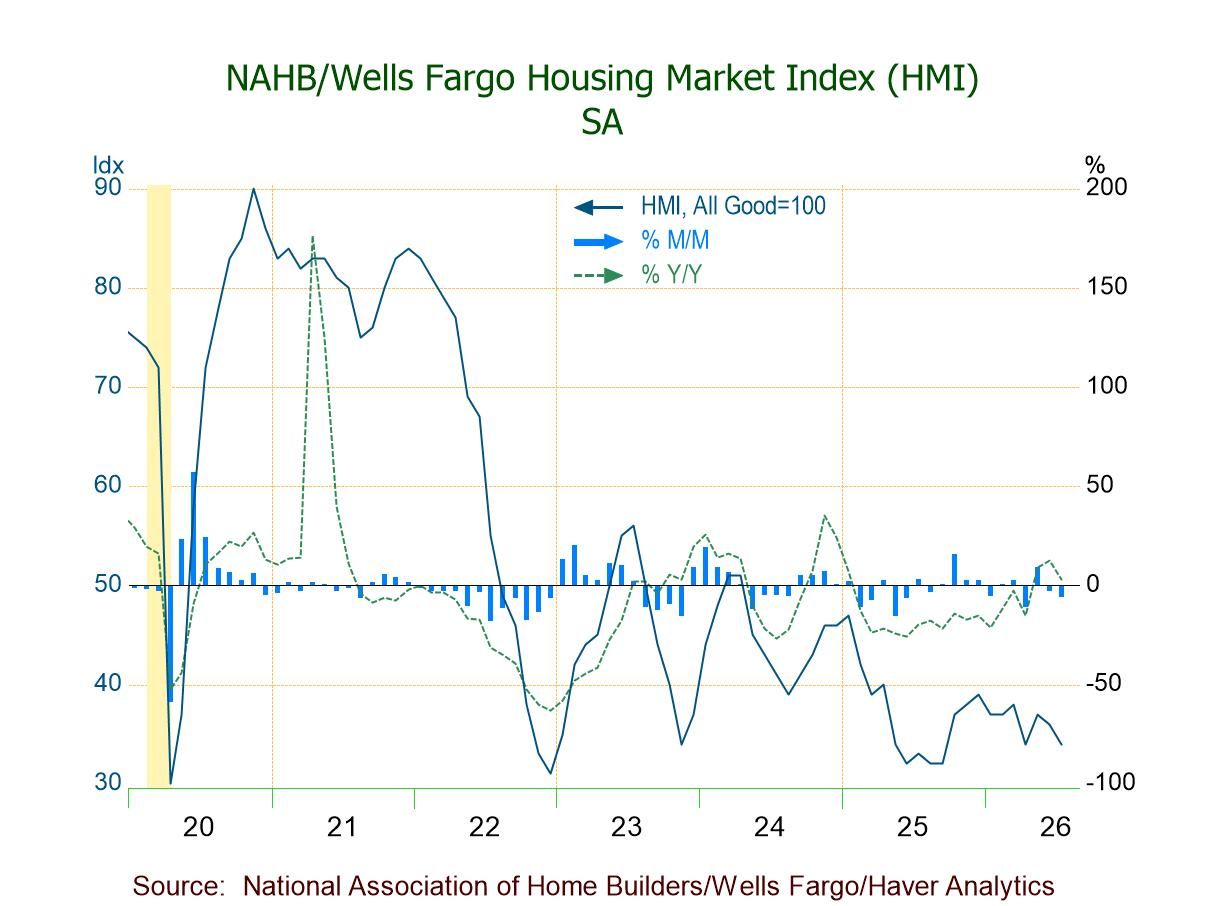
The Composite Housing Market Index from the National Association of Home Builders-Wells Fargo slipped to 57 this month and was unchanged y/y. The figure fell short of 59 expected in the Informa Global Markets Survey.
The index of single-family home sales edged down to 61 (-3.2% y/y) and remained below the expansion high of 63 reached twelve months ago. The index of expected sales during the next six months also slipped to 65 (+4.8% y/y). The NAHB figures are seasonally adjusted.
Realtors reported that their traffic index held steady at 45, up 4.7% y/y.
Housing market activity slipped in most of the country. In the Northeast the index fell 9.8% m/m (+15,0% y/y). The index reading for the South fell 6.5% and was down 3.3% y/y). In the Midwest the reading fell 3.6% (-11.5% y/y) but in the West
The NAHB has compiled the Housing Market Index since 1985. It reflects survey questions asking builders to rate market conditions as "good," "fair," "poor" or "very high" to "very low." The figure is thus a diffusion index with numerical results over 50 indicating a predominance of "good" readings. The weights assigned to the individual index components are .5920 for single-family detached sales, present time, .1358 for single-family detached sales, next six months and .2722 for traffic of prospective buyers. The results are included in Haver's SURVEYS database. The expectations figure is available in Haver's MMSAMER database.
| National Association of Home Builders | Dec | Nov | Oct | Dec'13 | 2014 | 2013 | 2012 |
|---|---|---|---|---|---|---|---|
| Composite Housing Market Index, SA (All Good=100) | 57 | 58 | 54 | 57 | 52 | 51 | 34 |
| Single-Family Sales: Present | 61 | 62 | 57 | 63 | 56 | 55 | 36 |
| Single-Family Sales: Next Six Months | 65 | 66 | 64 | 62 | 61 | 58 | 41 |
| Traffic of Prospective Buyers | 45 | 45 | 41 | 43 | 39 | 39 | 27 |
Empire State Factory Sector Index Turns Negative
by Tom Moeller December 15, 2014
The Federal Reserve Bank of New York reported that its Empire State Factory Index of General Business Conditions declined to -3.58 during December from an unrevised 10.16 in November. The figure indicated a declining level of activity for the first time since January of last year. Despite the deterioration, the reading for all of 2014 at 11.90 was its best yearly figure since 2010. December fell short of expectations for 12.0 in the Action Economics Forecast Survey.
Based on these figures, Haver Analytics calculates a seasonally adjusted index that is compatible to the ISM series. The adjusted figure fell to 48.0, also indicating a decline in business activity and the weakest reading in twelve months. A rising level of activity is indicated by a figure above 50. Since inception in 2001, the business conditions index has had a 68% correlation with the quarterly change in real GDP.
Each of the component series deteriorated this month. The employment reading, however, remained positive at 8.33 versus 8.51 in November. During the last ten years there has been a 71% correlation between the index level and the m/m change in factory sector payrolls. The new orders figure fell to -1.97, although it's been negative twice before this year. The shipments reading of -0.22 was its first negative since June of last year and was off from 27.08 just three months ago. Unfilled orders plunged to -23.96, their lowest in a year. The delivery times figure (-14.58) indicated the quickest delivery speeds since just after the recession.
The prices paid index was little changed at 10.42, the lowest level since July 2012. A much higher 9 percent of respondents reported paying lower prices, the most since 2009. Twenty percent realized increased prices, down from the 2011 high of 70%. During the last ten years, there has been a 70% correlation between the index and the 3-month change in the intermediate goods PPI.
Looking ahead, the Empire State index of expected business conditions in six months declined to 38.58, the lowest level since July. Component declines were broad-based except inventories, which rose sharply, and prices paid which were fairly steady. Capital expenditures fell sharply to the lowest level since July.
The Empire State figures are diffusion indexes which are calculated by subtracting the percent of respondents reporting poorer business conditions from those reporting improvement. Thus, they have a good correlation with growth in the series covered. The data is available in Haver's SURVEYS database. The ISM-adjusted headline index is calculated by Haver Analytics. The series date back only to 2001. The Consensus expectation figure can be found in Haver's AS1REPNA database.
| Empire State Manufacturing Survey | Dec | Nov | Oct | Dec'13 | 2014 | 2013 | 2012 |
|---|---|---|---|---|---|---|---|
| General Business Conditions (ISM Adjusted) | 48.0 | 52.0 | 50.6 | 49.3 | 52.4 | 50.0 | 51.8 |
| General Business Conditions (Diffusion Index, %) | -3.58 | 10.16 | 6.17 | 0.83 | 11.90 | 3.82 | 4.29 |
| New Orders | -1.97 | 9.14 | -1.73 | -3.46 | 7.93 | 1.13 | 1.47 |
| Shipments | -0.22 | 11.83 | 1.12 | 1.46 | 12.03 | 4.49 | 11.22 |
| Unfilled Orders | -23.96 | -7.45 | -4.55 | -17.11 | -9.03 | -8.74 | -8.83 |
| Delivery Time | -14.58 | -9.57 | -5.68 | -3.95 | -5.17 | -3.52 | -0.30 |
| Inventories | -11.46 | 0.00 | 2.27 | -1.32 | -1.80 | -5.73 | -2.91 |
| Number of Employees | 8.33 | 8.51 | 10.23 | 0.00 | 10.85 | 3.73 | 8.62 |
| Prices Paid | 10.42 | 10.64 | 11.36 | 17.11 | 20.90 | 21.53 | 24.71 |

Tom Moeller
AuthorMore in Author Profile »Prior to joining Haver Analytics in 2000, Mr. Moeller worked as the Economist at Chancellor Capital Management from 1985 to 1999. There, he developed comprehensive economic forecasts and interpreted economic data for equity and fixed income portfolio managers. Also at Chancellor, Mr. Moeller worked as an equity analyst and was responsible for researching and rating companies in the economically sensitive automobile and housing industries for investment in Chancellor’s equity portfolio. Prior to joining Chancellor, Mr. Moeller was an Economist at Citibank from 1979 to 1984. He also analyzed pricing behavior in the metals industry for the Council on Wage and Price Stability in Washington, D.C. In 1999, Mr. Moeller received the award for most accurate forecast from the Forecasters' Club of New York. From 1990 to 1992 he was President of the New York Association for Business Economists. Mr. Moeller earned an M.B.A. in Finance from Fordham University, where he graduated in 1987. He holds a Bachelor of Arts in Economics from George Washington University.
More Economy in Brief