 Global| Nov 16 2007
U.S. Industrial Production Decline Broad and Unexpected
by:Tom Moeller
|in:Economy in Brief
Summary
Industrial production declined during October versus a Consensus expectation for a 0.1% uptick. The decline was the first since January and it was the largest m/m in two years. Because of modest 0.2% gains during the prior two months [...]
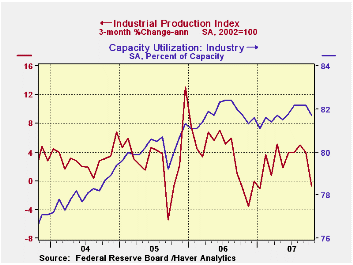
Industrial production declined during October versus a Consensus expectation for a 0.1% uptick. The decline was the first since January and it was the largest m/m in two years. Because of modest 0.2% gains during the prior two months the three month growth in industrial output fell to -0.7% (AR), its first time negative since early this year.
Factory output also was down and posted a 0.4% drop, its second 0.4% decline in the last three months. Those declines felled the three month growth rate to -2.7%, its first time negative since late lat year.
Easier output was broad based. Production in the motor vehicle & parts industries dropped 0.9% (+0.9% y/y). Output of furniture & related products suffered the weakness in the housing industry with a 0.2% (-2.6% y/y) decline while output of construction supplies fell 0.4% (+0.1% y/y), the forth consecutive monthly decline.
Returning to the consumer goods sector, production of
computers & electronics fell 0.9% (+14.6% y/y), down for the
third straight month. Apparel output also fell for the third
consecutive month (-4.6% y/y). Chemical products output fell as well by
0.5% (-1.3% y/y).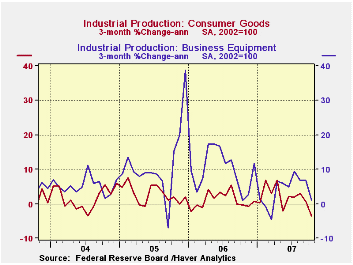
Output of business equipment held up with just a 0.1% decline (+4.6% y/y). Output of information & processing equipment, however, fell 0.3% and the three month growth fell to 2.9% versus double digit rates of growth earlier this year. Production of industrial equipment also has eased and it posted its second decline in the last three months. Three month growth rate fell to a negative 2.6% (AR).
In the materials category output fell 0.4%. Production of durable consumer parts fell 0.5%, unchanged over the last year and down for the second consecutive month. Production of durable equipment parts rose 0.3% (6.3% y/y) but other durable goods materials output fell 0.3% (+2.9% y/y).
Capacity utilization fell to 80.1%. Utilization in the factory sector fell m/m to 79.9% versus an average 80.2% last year. Capacity rose 0.1% (1.9% y/y).
Risk Management and the Economic Outlook is today's speech by Fed GovernorRandall S. Kroszner and it is available here.
| INDUSTRIAL PRODUCTION (SA) | October | September | Y/Y | 2006 | 2005 | 2004 |
|---|---|---|---|---|---|---|
| Total | -0.5% | 0.2% | 1.8% | 4.0% | 3.2% | 2.5% |
| Manufacturing | -0.4% | 0.2% | 2.1% | 5.0% | 4.0% | 3.0% |
| Mining | -0.6% | 0.6% | 0.4% | 2.7% | -1.6% | -0.6% |
| Utilities | -1.6% | -0.1% | 0.1% | 0.2% | 2.0% | 1.4% |
by Tom Moeller November 16, 2007
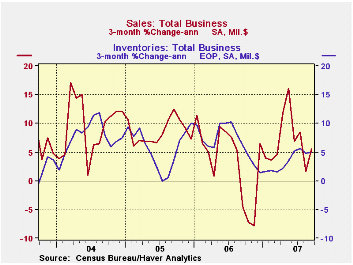
Total business inventories rose a moderate 0.4% during
September following the prior month's 0.3% gain. The three month change
in inventories remained stable with the prior few months, up from
earlier this year but half the growth rates seen last year. That
slowing remained a function of the slower growth in sales
Retail inventories ticked up just 0.1%. Inventories of motor
vehicles & parts dealers actually fell a slight 0.1% (+2.1%
y/y) after the 1.5% spurt during August. Excluding autos, retail
inventories rose a modest 0.2% following a little revised, negligible
August decline. Furniture inventories spurted 1.3% (3.3% y/y) and the
three month change rose to an excessive (9.9%, AR). At clothing
& accessory stores inventories rose 0.1% and offset a 0.1%
August downtick and it left the three month at a manageable 0.0%.
Inventories at General merchandise stores also seemed under control. a
0.4% gain followed declines during the prior three months and three
month growth was a negative 2.8%.
Wholesale inventories rose 0.8% following a very much upwardly revised 0.7% August increase. Petroleum inventories fell for third straight month (-1.3% y/y) and less petroleum, wholesale inventories rose 0.9%, up 5.4% y/y which is a y/y growth rate which has halved versus late last year. During the last ten years there has been a 59% correlation between the annual change in wholesale inventories les petroleum and the change in merchandise imports.
Factory inventories rose 0.6% (2.2% y/y) after two months of little change. Three month growth in manufacturers' inventories was 2.3% versus a 6.4% rate of growth during all of last year.
The Role of Money in Monetary Policy: Why Do the Fed and ECB See It So Differently? from t he Federal Reserve Bank of Kansas City can be found here.
| Business Inventories | September | August | Y/Y | 2006 | 2005 | 2004 |
|---|---|---|---|---|---|---|
| Total | 0.4% | 0.3% | 3.3% | 5.9% | 6.2% | 7.9% |
| Retail | 0.1% | 0.5% | 2.8% | 3.2% | 2.8% | 6.8% |
| Retail excl. Autos | 0.2% | -0.0% | 3.2% | 4.5% | 4.5% | 7.2% |
| Wholesale | 0.8% | 0.7% | 5.2% | 8.6% | 7.4% | 9.7% |
| Manufacturing | 0.6% | -0.1% | 2.2% | 6.4% | 8.9% | 7.7% |
by Carol Stone November 16, 2007
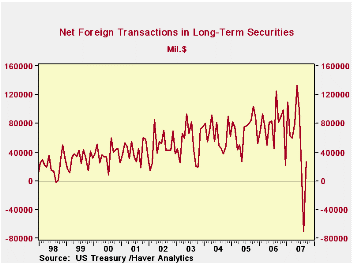
After their exodus from US financial markets in August, foreign investors returned in September with moderate net purchases of US long-term securities. These totaled $26.4 billion, compared with August's $70.6 billion liquidation (revised from the original $85.5 billion reported).
Even as foreign investors returned, they did so in a much more
limited way than earlier this year, and with a more conservative asset
mix. Net purchases of domestic securities were $55.4 billion, almost
half of which, $26.3 billion, were Treasuries. Both private and
official foreign institutions were net buyers both of Treasuries and in
total. Back in August, private foreigners had been net purchasers of
Treasuries as well, but official institutions were net sellers then.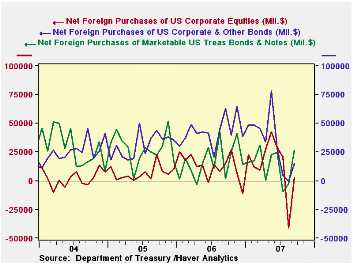
There were net purchases of all three of the other securities
categories, $11.5 billion in Agencies, $15.1 billion in corporate bonds
and $2.5 billion in equities. The resumption of corporate bond
purchases is impressive after August's small net sales, although the
amount is modest compared with a $43 billion monthly average during
2006 and $47 billion in the first half of this year. Regarding
equities, it looks that the most we can say, with just $2.5 billion in
purchases, is that the net selling stopped. The figures here don't show
much conviction about increasing US equity positions. So foreign
investors highlighted Treasury securities in their September
acquisitions, but were restrained toward other, riskier securities.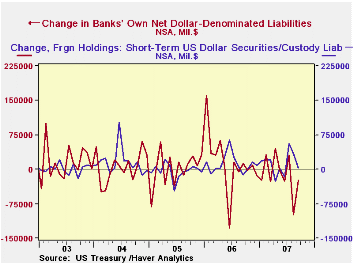
Last month here, we emphasized the erratic nature of other types of foreigners' participation in the US financial system. They can buy short-term securities, including Treasury bills, or other paper, and they had done so in size in July and August, $56.2 billion and $33.9 billion, respectively. In September, however, this practice was far less extensive, as only $3.8 billion went into these assets. By then, rates on T-bills were quite low and the market for commercial paper was shrinking rapidly, making those both less attractive outlets. And as we pointed out in our summary of August data, these items are by definition transitory holdings anyway. Also, bank deposits from foreign account holders and other bank liabilities to foreigners had decreased sharply in August, and these actually continued to do so in September. Possibly the unpopular dollar is a main factor here, as traders reduce their cash in US banks when they sell dollars. Again, though, substantive explanations are hard to come by for these assets, since they too are largely short-term holdings.
So it is encouraging to see a return to net inflows to US markets from foreign investors, but the September performance still shows significant hesitation. As we also mentioned last month, this is no different from the attitudes of US investors, is it?
| Net Foreign Purchases from US Residents, Bil $ | Sept 2007 | August 2007 | July 2007 | June 2007 | Monthly Averages | ||
|---|---|---|---|---|---|---|---|
| Last 12 Months | 2006 | 2005 | |||||
| "Headline": Net
Foreign Purchases = 1 + 2 + Other* |
26.4 | -70.6 | 19.5 | 99.9 | 60.8 | 76.2 | 69.9 |
| 1. Domestic Securities | 55.4 | -36.1 | 25.0 | 121.7 | 87.8 | 97.2 | 84.3 |
| Treasuries | 26.3 | -2.8 | -9.4 | 24.7 | 17.3 | 17.3 | 28.2 |
| Agencies | 11.5 | 8.4 | 8.7 | 39.6 | 21.0 | 24.5 | 18.3 |
| Corporate Bonds | 15.1 | -0.9 | 4.5 | 28.5 | 41.0 | 42.8 | 31.0 |
| Equities | 2.5 | -40.6 | 21.2 | 28.8 | 13.4 | 12.6 | 6.8 |
| 2. Foreign Securities | -29.0 | -34.5 | -5.5 | -21.8 | -27.0 | -21.0 | -14.4 |
| 3. Short-Term Sec's & Custody Holdings | 3.8 | 33.9 | 56.2 | -16.0 | 11.7 | 12.2 | -4.0 |
| 4. Banks' Liabilities | -24.3 | -97.8 | 30.3 | -15.4 | -8.5 | 15.3 | 1.4 |
| Total TIC Flows** | -14.7 | -150.7 | 83.5 | 43.6 | 47.4 | 89.5 | 55.4 |
| China | 8.5 | -10.1 | 4.5 | 21.2 | 10.0 | 9.7 | 7.4 |
| United Kingdom | -4.4 | 31.7 | 25.1 | 55.4 | 35.7 | 26.5 | 26.4 |
| Cayman Islands | 14.8 | -14.7 | -16.4 | 9.6 | 7.3 | 12.1 | 4.1 |
| *"Other" includes stock swaps and repayments of capital on asset-backed securities. | |||||||
| **Sum of Lines 1. through 4 (plus "other" noted above. Line 1 is the sum of the security types listed immediately below it.) | |||||||
by Robert Brusca November 16, 2007
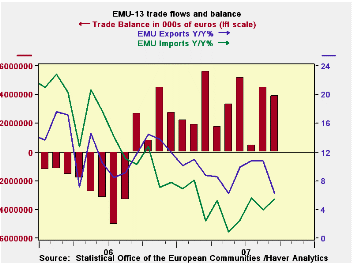
Exports slow as imports rise.
It is too soon to chalk up the dwindling trade surplus of
Europe to the high Euro, but this month’s report is another hint. The
surplus is sketching out a shrinking pattern beyond the simple drop of
this month's balance. And exports and imports are starting to assume
the position of trade flows in transition. Exports have shed their bump
up in the growth rate that may just have been a J-curve effect of the
euro’s rise. Imports are rising more rapidly and that could shift if
the strong euro weakens European growth. Still, the strong euro makes
imports cheaper and that would account for some import rise in the
aftermath of shoot up in the currency’s value even as import prices
fell in domestic currency terms (euro terms).
| Euro area 13-Trade Trends for Goods | |||||
|---|---|---|---|---|---|
| m/m% | % SAAR | ||||
| Sep-07 | Aug-07 | 3-Mo | 6-Mo | 12-Mo | |
| Balance* | €€ 3,905 | €€ 4,511 | €€ 2,957 | €€ 3,195 | €€ 3,080 |
| Exports | |||||
| All Exports | -0.4% | 3.5% | 7.3% | 8.3% | 6.3% |
| Food and Drinks | -2.0% | 2.4% | 11.7% | 8.5% | 9.5% |
| Raw Materials | 3.0% | -1.6% | -0.2% | 9.5% | 4.5% |
| Manufacturing | -2.3% | 3.0% | 0.8% | 4.0% | 4.0% |
| Imports | |||||
| All Imports | 0.1% | 0.2% | 12.2% | 11.7% | 5.4% |
| Food and Drinks | 5.1% | 0.7% | 31.3% | 22.4% | 14.2% |
| Raw Materials | -6.8% | 0.8% | -14.8% | -2.9% | 0.4% |
| Manufacturing | -2.7% | 1.1% | 0.8% | 2.7% | 4.0% |
| *Million Euros; mo or period average | |||||

Tom Moeller
AuthorMore in Author Profile »Prior to joining Haver Analytics in 2000, Mr. Moeller worked as the Economist at Chancellor Capital Management from 1985 to 1999. There, he developed comprehensive economic forecasts and interpreted economic data for equity and fixed income portfolio managers. Also at Chancellor, Mr. Moeller worked as an equity analyst and was responsible for researching and rating companies in the economically sensitive automobile and housing industries for investment in Chancellor’s equity portfolio. Prior to joining Chancellor, Mr. Moeller was an Economist at Citibank from 1979 to 1984. He also analyzed pricing behavior in the metals industry for the Council on Wage and Price Stability in Washington, D.C. In 1999, Mr. Moeller received the award for most accurate forecast from the Forecasters' Club of New York. From 1990 to 1992 he was President of the New York Association for Business Economists. Mr. Moeller earned an M.B.A. in Finance from Fordham University, where he graduated in 1987. He holds a Bachelor of Arts in Economics from George Washington University.
More Economy in Brief


