 Global| Jun 17 2008
U.S. Industrial Output Fell Unexpectedly in May
by:Tom Moeller
|in:Economy in Brief
Summary
Industrial production unexpectedly fell 0.2% last month following an unrevised 0.7% April drop. The latest decline was counter to the Consensus expectation for a 0.1% rise and it lowered the level of output 1.4% below its January [...]
Industrial production unexpectedly fell 0.2% last month following an unrevised 0.7% April drop. The latest decline was counter to the Consensus expectation for a 0.1% rise and it lowered the level of output 1.4% below its January peak.
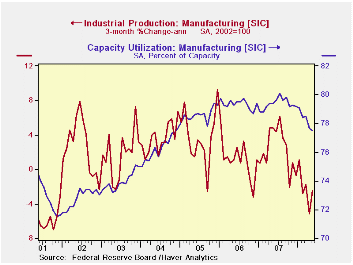
The May decline in the total was due to a 1.8% (-0.6% y/y) drop in utility output. Factory output was unchanged (-0.3% y/y) but that followed the sharp, downwardly revised 0.9% decline during April. Output has now fallen 1.6% since its peak in July of 2007 and the three-month rate change was a negative 2.5% (AR).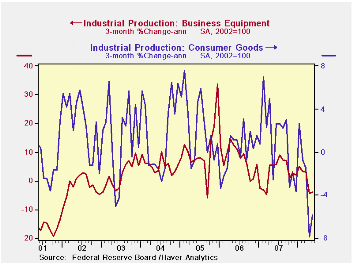
Production in the high tech sector again was firm and rose 1.1% (25.0% y/y). Production of computers & office equipment rose a lessened 0.8% (16.7% y/y) because the three-month growth rate slowed to 8.1% (AR). Output of communications equipment rose 0.8% and three-month growth totaled 17.8%.
The trend in output outside the high-tech sector has been decidedly weak. Less high-tech, factory output fell 0.1% last month and three-month output growth was a negative 4.1% (AR). Output of motor vehicles & parts did rise 1.0% in May but three-month growth was a negative 36.2%. May output of furniture fell 0.4% and at an 8.8% rate during the last three months. Electrical equipment turned a bit of a corner with a 1.2% increase. During the last three months output here is up 9.9% (AR). Machinery output fell quite hard, again. A 1.5% May decline followed a 2.4% shortfall in April.
In the nondurables area output was unchanged and that was due to a 0.6% rise in chemical production. It's risen at a 3.2% rate during the last three months. Conversely, apparel output fell 0.9% and at a 14.2% rate during the last three months. Petroleum output also is down at a 5.7% since February and plastics are down 5.3%.
Capacity utilization fell again to 79.4% from 79.6% during April. Utilization in the factory sector fell to 77.5%, its lowest also since late-2004.Inertial Taylor Rules: The Benefit of Signaling Future Policy from the Federal Reserve Bank of St. Louis can be found here.
| INDUSTRIAL PRODUCTION (SA) | May | April | Y/Y | 2007 | 2006 | 2005 |
|---|---|---|---|---|---|---|
| Total | -0.2 | -0.7 | -0.1 | 1.7 | 2.2 | 3.3 |
| Manufacturing | -0.8 | 0.0 | -0.3 | 1.7 | 2.4 | 4.0 |
| Consumer Goods | -0.2 | -1.1 | -1.6 | 1.7 | 0.3 | 2.8 |
| Business Equipment | 0.0 | -1.7 | 2.2 | 3.3 | 10.4 | 7.3 |
| Construction Supplies | -0.2 | -1.4 | -5.6 | -2.5 | 2.2 | 4.5 |
| Utilities | 0.4 | 0.7 | 0.8 | 3.3 | -0.6 | 2.1 |

Tom Moeller
AuthorMore in Author Profile »Prior to joining Haver Analytics in 2000, Mr. Moeller worked as the Economist at Chancellor Capital Management from 1985 to 1999. There, he developed comprehensive economic forecasts and interpreted economic data for equity and fixed income portfolio managers. Also at Chancellor, Mr. Moeller worked as an equity analyst and was responsible for researching and rating companies in the economically sensitive automobile and housing industries for investment in Chancellor’s equity portfolio. Prior to joining Chancellor, Mr. Moeller was an Economist at Citibank from 1979 to 1984. He also analyzed pricing behavior in the metals industry for the Council on Wage and Price Stability in Washington, D.C. In 1999, Mr. Moeller received the award for most accurate forecast from the Forecasters' Club of New York. From 1990 to 1992 he was President of the New York Association for Business Economists. Mr. Moeller earned an M.B.A. in Finance from Fordham University, where he graduated in 1987. He holds a Bachelor of Arts in Economics from George Washington University.
More Economy in Brief


