 Global| Jun 17 2008
U.S. Industrial Output Fell Unexpectedly in May
by:Tom Moeller
|in:Economy in Brief
Summary
Industrial production unexpectedly fell 0.2% last month following an unrevised 0.7% April drop. The latest decline was counter to the Consensus expectation for a 0.1% rise and it lowered the level of output 1.4% below its January [...]
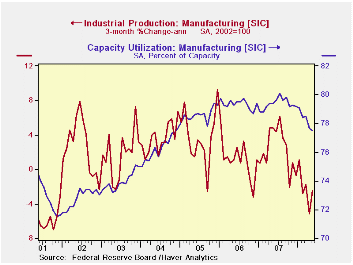
Industrial production unexpectedly fell 0.2% last month following an unrevised 0.7% April drop. The latest decline was counter to the Consensus expectation for a 0.1% rise and it lowered the level of output 1.4% below its January peak.
The May decline in the total was due to a 1.8% (-0.6% y/y)
drop in utility output. Factory output was unchanged (-0.3% y/y) but
that followed the sharp, downwardly revised 0.9% decline during April.
Output has now fallen 1.6% since its peak in July of 2007 and the
three-month rate change was a negative 2.5% (AR).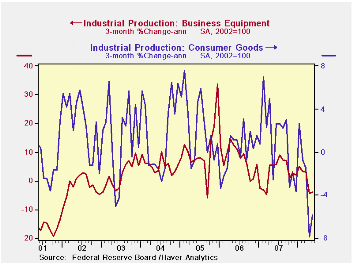
Production in the high tech sector again was firm and rose 1.1% (25.0% y/y). Production of computers & office equipment rose a lessened 0.8% (16.7% y/y) because the three-month growth rate slowed to 8.1% (AR). Output of communications equipment rose 0.8% and three-month growth totaled 17.8%.
The trend in output outside the high-tech sector has been decidedly weak. Less high-tech, factory output fell 0.1% last month and three-month output growth was a negative 4.1% (AR). Output of motor vehicles & parts did rise 1.0% in May but three-month growth was a negative 36.2%. May output of furniture fell 0.4% and at an 8.8% rate during the last three months. Electrical equipment turned a bit of a corner with a 1.2% increase. During the last three months output here is up 9.9% (AR). Machinery output fell quite hard, again. A 1.5% May decline followed a 2.4% shortfall in April.
In the nondurables area output was unchanged and that was due to a 0.6% rise in chemical production. It's risen at a 3.2% rate during the last three months. Conversely, apparel output fell 0.9% and at a 14.2% rate during the last three months. Petroleum output also is down at a 5.7% since February and plastics are down 5.3%.
Capacity utilization fell again to 79.4% from 79.6% during April. Utilization in the factory sector fell to 77.5%, its lowest also since late-2004.
Inertial Taylor Rules: The Benefit of Signaling Future Policy from the Federal Reserve Bank of St. Louis can be found here.
| INDUSTRIAL PRODUCTION (SA) | May | April | Y/Y | 2007 | 2006 | 2005 |
|---|---|---|---|---|---|---|
| Total | -0.2 | -0.7 | -0.1 | 1.7 | 2.2 | 3.3 |
| Manufacturing | -0.8 | 0.0 | -0.3 | 1.7 | 2.4 | 4.0 |
| Consumer Goods | -0.2 | -1.1 | -1.6 | 1.7 | 0.3 | 2.8 |
| Business Equipment | 0.0 | -1.7 | 2.2 | 3.3 | 10.4 | 7.3 |
| Construction Supplies | -0.2 | -1.4 | -5.6 | -2.5 | 2.2 | 4.5 |
| Utilities | 0.4 | 0.7 | 0.8 | 3.3 | -0.6 | 2.1 |
by Tom Moeller June 17, 2008
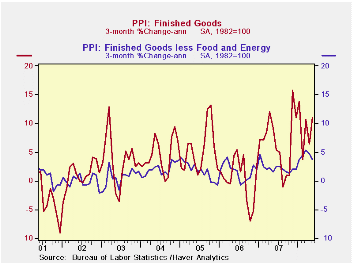
U.S. finished producer prices jumped 1.4% last month and the increase was the largest since a 2.6% rise last November. The increase surpassed Consensus expectations for a 1.0% rise.
Finished energy prices surged 4.9% (19.4% y/y) as gasoline prices jumped 9.3% (26.3% y/y). Natural gas prices also were quite strong and they rose 3.1% (12.4% y/y) while home heating oil prices increased 8.0% (58.4% y/y). Residential electric power costs rose 0.6% (4.8% y/y).
Finished consumer food prices were strong again and rose 0.8%
(6.6% y/y). The strength was led by fresh vegetables (17.1% y/y), pasta
products (37.8% y/y) and dairy products (7.0% y/y). Meat prices
continued to decline.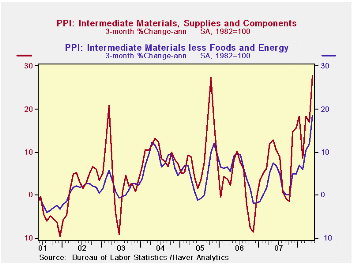
Less food & energy, the gain in finished goods prices eased to 0.2% from 0.4% in April. The latest figure matched expectations. Prices of core finished consumer goods rose 0.3% (3.5% y/y) and the annual rate of increase leveled out. Durable consumer goods prices reversed the April increase and fell 0.4% (1.7% y/y). Capital equipment prices rose 0.1% (2.3% y/y).
Intermediate goods prices surged by 2.9% after the 0.9% April increase. Excluding food & energy these prices spiked another 2.0%.
The crude materials PPI jumped 6.7% due to a 13.1% (67.0% y/y) spike in energy prices. Crude food prices also were strong and jumped 1.8% (16.7% y/y). Crude petroleum prices have more than doubled y/y while natural gas prices also surged by 17.0% (49.7% y/y).
Inflation Regimes and Inflation Expectations from the Federal Reserve Bank of St. Louis is available here.
| Producer Price Index (%) | May | April | Y/Y | 2007 | 2006 | 2005 |
|---|---|---|---|---|---|---|
| Finished Goods | 1.4 | 0.2 | 7.2 | 3.9 | 3.0 | 4.9 |
| Core | 0.2 | 0.4 | 3.0 | 1.9 | 1.5 | 2.4 |
| Intermediate Goods | 2.9 | 0.9 | 12.5 | 4.1 | 6.4 | 8.0 |
| Core | 2.0 | 1.2 | 7.4 | 2.8 | 6.0 | 5.5 |
| Crude Goods | 6.7 | 3.2 | 41.7 | 12.1 | 1.4 | 14.6 |
| Core | 5.0 | 7.9 | 33.2 | 15.7 | 20.8 | 4.9 |
by Tom Moeller June 17, 2008
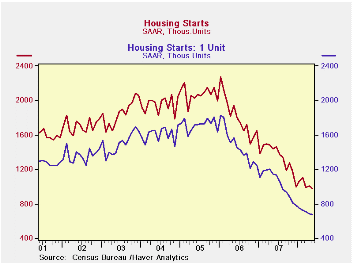
Housing starts fell slightly more-than-expected last month. The 3.3% m/m decline to 975,000 units (AR) was from a downwardly revised 1,008 units in April. The latest level was the lowest since January 1991 and Consensus expectations had been for 980,000 starts in May.
Single-family starts continued weak and fell 1.0% from April
to 674,000, also the lowest since 1991. So far 2Q starts are down at a
25% annual rate from 1Q.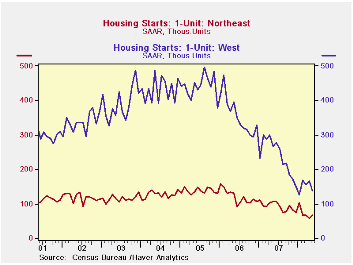
By region the decline in single-family starts was led last month by an 18.0% (-48.7% y/y) drop in the West. Elsewhere in the country, starts rose. In the Northeast single-family starts rose 11.9% (-38.3% y/y) and made up all of the prior month's decline. In the Midwest starts rose 5.7% (-42.8% y/y) to the highest level since January. Finally, single-family starts in the South ticked up just 2.9% (-37.7% y/y) and made up nearly half of the decline in April.
Multi-family starts last month declined 8.0% and reversed half of the April increase.
Building permits slipped 1.3% after a 5.4% rise during April. Single-family permits fell 4.0% to a new low for this cycle.
Inflation and the Size of Government from the Federal Reserve Bank of St. Louis is available here
| Housing Starts (000s, AR) | May | April | Y/Y | 2007 | 2006 | 2005 |
|---|---|---|---|---|---|---|
| Total | 975 | 1,008 | -32.1% | 1,344 | 1,812 | 2,073 |
| Single-Family | 674 | 681 | -41.2% | 1,039 | 1,474 | 1,719 |
| Multi-Family | 301 | 327 | 3.8% | 304 | 338 | 354 |
| Building Permits | 969 | 982 | -36.3% | 1,371 | 1,842 | 2,159 |
by Tom Moeller June 17, 2008
The retail price for a gallon of regular gasoline rose another four cents last week to $4.08 per gallon, according to the U.S. Department of Energy survey. The rise followed the previous week's six cent increase. For all grades of gasoline the average price also rose last week by four cents to an average $4.13 per gallon.
Yesterday, the spot market price for a gallon of regular
gasoline slipped yesterday to $3.33, but that was still up five cents
from last week's average.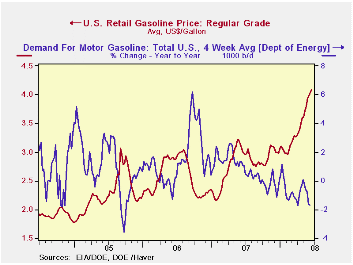
Weekly gasoline prices can be found in Haver's WEEKLY database, daily prices are in the DAILY database.
According to the U.S. Department of Energy the increase in gasoline prices, along with the slowdown in economic growth, have lowered the demand for gasoline during the latest four weeks by 1.7% from a year earlier. Refinery production of gasoline is down 0.8% year-to-year.
The DOE figures are available in Haver's OILWKLY database.
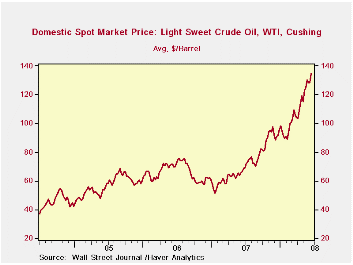
During all of last week, the price of a barrel of WTI crude oil rose to an average of $134.73 but yesterday the price held above $130 at $134.62.
Natural gas prices slipped to $12.601/mmbtu up 67.43% versus a year earlier.
Crude Awakening: Behind the Surge in Oil Prices from the Federal Reserve Bank of Dallas can be found here.
| Weekly Prices | 06/16/08 | 06/09/08 | Y/Y | 2007 | 2006 | 2005 |
|---|---|---|---|---|---|---|
| Retail Regular Gasoline ($ per Gallon) | 4.08 | 4.04 | 35.7% | 2.80 | 2.57 | 2.27 |
| Light Sweet Crude Oil, WTI ($ per bbl.) | 134.73 | 128.14 | 102.1% | 72.25 | 66.12 | 56.60 |
by Louise Curley June 9,2008
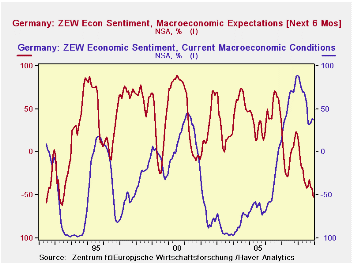
Two measures of Business Confidence in Germany were released today--the closely watched ZEW and the less well known DIHK. Both show a sharp loss of confidence in the outlook and a continued deterioration in the appraisal of current conditions.
The excess of pessimists among German institutional investors and analysts, represented in the ZEW measure, rose to 52.4% in June from 41.4% in May. The current excess of pessimists is the highest since October, 1992. In June of last year, there was an excess of optimists of 20.3% regarding the outlook. There is still an excess of optimists regarding current conditions. The percent balance in June was 37.6% down 1 percentage point from May, but down 51.2 percentage points from June 2007. The current conditions and expectations of the ZEW participants are shown in the first chart.
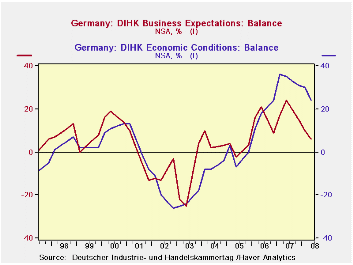
Among the members of the Association of German Chambers of Industry and Commerce (DIHK) there is still an excess of optimists, 6%, regarding the outlook but it is down 4 percentage points from February and 18 percentage points from June of last year. A similar trend is apparent in the appraisal of current conditions. The excess of optimists is down 6 percentage points from February and 11 points from June of last year. The current conditions and expectations of the DIHK members are shown in the second chart. (We have interpolated the data to show a smooth trend.)
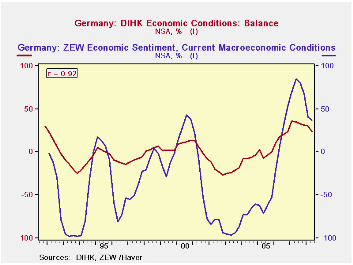
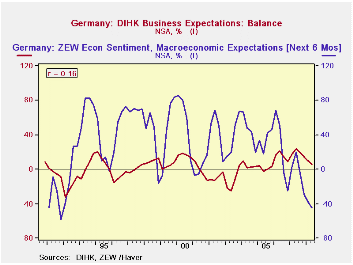
The two surveys differ in sample size and in occupations. In June ZEW canvassed 264 individuals in the financial community while DIHK canvassed the 25,000 members of the Association of German Chambers of Industry and Commerce, 35% of whom were in industry, 6% in construction, 24% in wholesale and retail trade and 35% in services. ZEW surveys its members monthly while DIHK surveys its members three times a year in February, June and October. Because of the differences in timing, comparisons between the two series are not easy. If we aggregate the ZEW data to a quarterly basis and compare it to the interpolated series of the DIHK data we have a rough comparison. For what is worth, the rough comparison between the appraisals of current conditions in the two series shows a close correlation, but the rough comparison between the appraisals of expectations in the two indicators shows very little correlation as can be seen in the third and fourth charts.
| GERMANY: CONFIDENCE INDICATORS | Jun 08 | May 08 | Jun 07 | M/M Chg | Y/Y Chg | 2007 | 2006 | 2005 |
|---|---|---|---|---|---|---|---|---|
| ZEW Indicator (% balance) | ||||||||
| Current Conditions | 37.6 | 38.6 | 88.7 | -1.0 | -51.1 | 75.9 | 18.3 | -61.8 |
| Expectations | -52.4 | -41.4 | 20.3 | -11.0 | -72.7 | -3.0 | 22.3 | 34.8 |
| DIHK Indicator (% balance) | Jun 08 | Feb 08 | Oct 07 | Jun 07 | Feb 07 | Oct 06 | Feb to June Chg |
Y/Y Chg |
| Current Conditions | 24 | 30 | 31 | 35 | 36 | 24 | -6 | -11 |
| Expectations | 6 | 10 | 15 | 24 | 17 | 9 | -4 | -18 |

Tom Moeller
AuthorMore in Author Profile »Prior to joining Haver Analytics in 2000, Mr. Moeller worked as the Economist at Chancellor Capital Management from 1985 to 1999. There, he developed comprehensive economic forecasts and interpreted economic data for equity and fixed income portfolio managers. Also at Chancellor, Mr. Moeller worked as an equity analyst and was responsible for researching and rating companies in the economically sensitive automobile and housing industries for investment in Chancellor’s equity portfolio. Prior to joining Chancellor, Mr. Moeller was an Economist at Citibank from 1979 to 1984. He also analyzed pricing behavior in the metals industry for the Council on Wage and Price Stability in Washington, D.C. In 1999, Mr. Moeller received the award for most accurate forecast from the Forecasters' Club of New York. From 1990 to 1992 he was President of the New York Association for Business Economists. Mr. Moeller earned an M.B.A. in Finance from Fordham University, where he graduated in 1987. He holds a Bachelor of Arts in Economics from George Washington University.
More Economy in Brief


