 Global| May 15 2008
U.S. Industrial Output Fell Hard Last Month
by:Tom Moeller
|in:Economy in Brief
Summary
Industrial production fell a sharp 0.7% last month after a little revised increase of 0.2% during March. The decline was close to the largest since September 2005 and it was more than double Consensus expectations for a 0.3% drop. [...]
Industrial production fell a sharp 0.7% last month after a little revised increase of 0.2% during March. The decline was close to the largest since September 2005 and it was more than double Consensus expectations for a 0.3% drop.
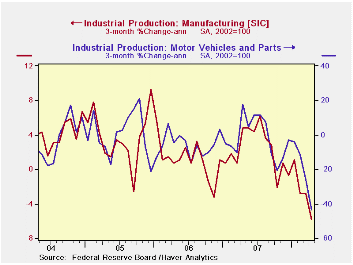
Factory output fell a slightly sharper 0.8% after no change during March. Output has now fallen 1.8% since its peak in July of 2007 and the three month rate change was a negative 5.8% (AR).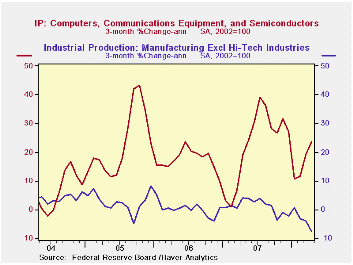
Production in the high tech sector continued strong and rose 1.0% (24.5% y/y) while the three month rate of change amounted to 23.5%. Production of computers & office equipment rose a lesser 0.5% and three month growth totaled 9.8% (AR). Output of communications equipment rose an even stronger 2.1%. The three month rate of growth was 27.5%.
The trend in output outside the high tech sector has been decidedly different and one of weakness. Less high tech, factory output fell 0.9% last month and three month output growth fell to -7.6% (AR). Output of motor vehicles & parts has been notably weak and fell 8.2% last month, at a -43.5% annual rate during the last three months. Furniture output also fell 0.7% last month and at a hard 10.2% rate during the last three. Electrical equipment fell 0.8% during April and at a 2.6% rate during the last three months. Machinery output also was quite weak and fell 1.7% and at a three month rate of -9.1% 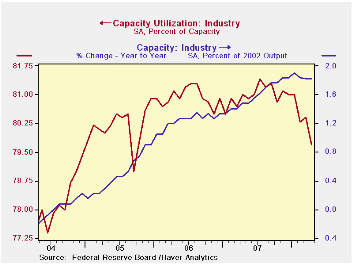
In the nondurables area the picture is little better. Output ticked down 0.1% last month and at a 3.3% rate during the last three. Though apparel output rose 0.1% last month it followed sharp declines during the prior three. Three month annual growth was -7.0%. Paper output has been falling at an 8.9% rate during the last three months and chemical output is off at a 3.4% rate.
Capacity utilization fell sharply to 79.7% during April but utilization in the factory sector slipped even further to 77.5%, its lowest also since late 2004. Utilization rates in the durables industries outside of high tech were notably weak, exemplified by the machinery industry where utilization fell to 74.6% versus 81% nearly two years ago. Overall capacity grew 1.8% during the last year and 2.0% in the factory sector. Less high tech, factory capacity grew a lower 0.9% over the last year.Risk Management in Financial Institutions is today's speech by Fed Chairman Ben S. Bernanke and it is available here.
| INDUSTRIAL PRODUCTION (SA) | April | March | Y/Y | 2007 | 2006 | 2005 |
|---|---|---|---|---|---|---|
| Total | -0.7 | 0.2 | 0.2 | 1.7 | 2.2 | 3.3 |
| Manufacturing | -0.8 | 0.0 | -0.3 | 1.7 | 2.4 | 4.0 |
| Utilities | 0.4 | 0.7 | 0.8 | 3.3 | -0.6 | 2.1 |
by Tom Moeller May, 2008
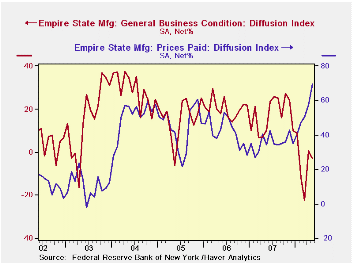
The May index of manufacturing activity in New York State slipped to -3.23% and gave back a small piece of the prior month's improvement. It was just slightly more of a decline than expectations for a May reading of zero. The figure is a diffusion index and it is reported by the Federal Reserve Bank of New York.
Since the series' inception in 2001 there has been a 55% correlation between the index level and the three month change in U.S. factory sector industrial production.
Weaker shipments accounted for most of the overall decline while new orders fell just slightly and employment rose. In the (perhaps too) short seven year history of the NY employment index, there has been an 85% correlation between it and the three month growth in overall factory sector employment.
Like the Philadelphia Fed Index of General Business Conditions, the Empire State Business Conditions Index reflects answers to an independent survey question; it is not a weighted combination of the components.
Pricing pressure advanced sharply yet again. The latest index level of 69.57 set a new record. Since the series' inception in 2001 there has been an 81% correlation between the index of prices paid and the three month change in the core intermediate materials PPI.
The Empire State index of expected business conditions in six months ticked up just slightly and remained near the lowest level since 2001.
The Empire State Manufacturing Survey is a monthly survey of manufacturers in New York State conducted by the Federal Reserve Bank of New York. Participants from across the state in a variety of industries respond to a questionnaire and report the change in a variety of indicators from the previous month. Respondents also state the likely direction of these same indicators six months ahead.For more on the Empire State Manufacturing Survey, including methodologies and the latest report, click here.
| Empire State Manufacturing Survey | May | April | May '07 | 2007 | 2006 | 2005 |
|---|---|---|---|---|---|---|
| General Business Conditions (diffusion index, %) | -3.23 | 0.63 | 10.10 | 17.23 | 20.24 | 15.53 |
| Prices Paid | 69.57 | 57.29 | 34.44 | 35.64 | 41.88 | 44.74 |
by Tom Moeller May 15, 2008
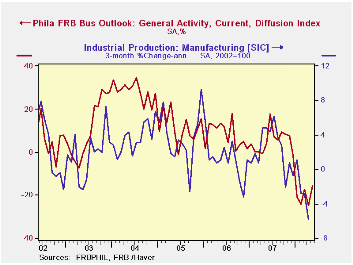
The May Index of General Business conditions in the manufacturing sector, from the Philadelphia Federal Reserve Bank, rose to -15.6 and reversed all of its deterioration in April. The latest was the highest level this year.
The Philadelphia Fed constructs a diffusion index for total business activity and each of the sub indexes. The business conditions index reflects a separate survey question, not the sub indexes listed below.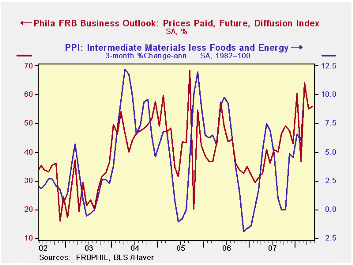
During the last ten years there has been a 59% correlation between the level of the Philadelphia Fed Business Conditions Index and the three-month growth in factory sector industrial production. There has been a 42% correlation with q/q growth in real GDP.
The new orders sub-index improved the most during May while shipments, inventories and employment also rose.
The prices paid index advanced sharply to its highest level since January 2005. During the last ten years there has been a 76% correlation between the prices paid index and the three-month growth in the intermediate goods PPI. There has been an 85% correlation with the change in core intermediate goods prices.
The separate index of expected business conditions in six months again rose sharply this month to a level of 28.2 from 13.7 in April. Expectations for each sub-component rose sharply and the overall series was at it's highest since last October.
The latest Business Outlook Survey from the Federal Reserve Bank of Philadelphia can be found here.
| Philadelphia Fed (%) | May | April | May '07 | 2007 | 2006 | 2005 |
|---|---|---|---|---|---|---|
| General Activity Index | -15.6 | -24.9 | 4.1 | 5.1 | 8.1 | 11.5 |
| Prices Paid Index | 53.8 | 51.6 | 29.6 | 26.4 | 36.6 | 40.1 |
by Tom Moeller May 15, 2008
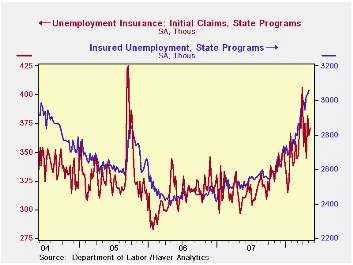
Initial claims for unemployment insurance last week ticked up a modest 6,000 to 371,000 following the prior week's little revised 17,000 rise. Consensus expectations had been for claims to total 370,000 last week.
The four week moving average of initial claims fell very slightly week-to-week to 365,750 (19.5% y/y). Claims averaged 365,000 during April.
A claims level below 400,000 typically has been associated with growth in nonfarm payrolls. During the last ten years there has been a (negative) 76% correlation between the level of initial claims and the m/m change in nonfarm payroll employment.
Continuing claims for unemployment insurance rose 28,000 after a gain of 2,000 during the prior week. That was revised from the initial report of a moderate decline. The latest level was the highest since March 2004. It provides some indication of workers' ability to find employment.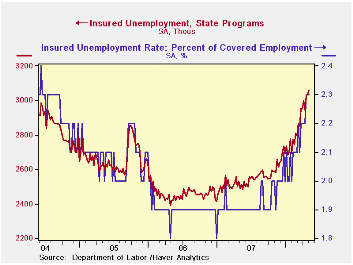
The continuing claims numbers lag the initial claims figures by one week.
The insured rate of unemployment held steady at 2.3% for the third week. That was the highest since 2004.
Yesterday's speech by Fed Governor Randall S. Kroszner titled Risk Management and Basel II can be found here.
| Unemployment Insurance (000s) | 05/10/08 | 05/03/08 | Y/Y | 2007 | 2006 | 2005 |
|---|---|---|---|---|---|---|
| Initial Claims | 371 | 365 | 22.8% | 322 | 313 | 331 |
| Continuing Claims | -- | 3,060 | 22.9% | 2,552 | 2,459 | 2,662 |

Tom Moeller
AuthorMore in Author Profile »Prior to joining Haver Analytics in 2000, Mr. Moeller worked as the Economist at Chancellor Capital Management from 1985 to 1999. There, he developed comprehensive economic forecasts and interpreted economic data for equity and fixed income portfolio managers. Also at Chancellor, Mr. Moeller worked as an equity analyst and was responsible for researching and rating companies in the economically sensitive automobile and housing industries for investment in Chancellor’s equity portfolio. Prior to joining Chancellor, Mr. Moeller was an Economist at Citibank from 1979 to 1984. He also analyzed pricing behavior in the metals industry for the Council on Wage and Price Stability in Washington, D.C. In 1999, Mr. Moeller received the award for most accurate forecast from the Forecasters' Club of New York. From 1990 to 1992 he was President of the New York Association for Business Economists. Mr. Moeller earned an M.B.A. in Finance from Fordham University, where he graduated in 1987. He holds a Bachelor of Arts in Economics from George Washington University.
More Economy in Brief


