 Global| Aug 04 2008
U.S. Income Gain Modest after May Surge
by:Tom Moeller
|in:Economy in Brief
Summary
Nominal personal income inched up 0.1% last month following a revised 1.8% May surge which was due to the first installment of the government's tax rebate checks being mailed out. During May, the government distributed $48.1 billion [...]
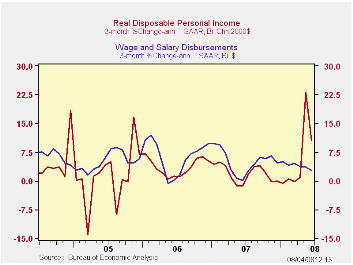
Nominal personal income inched up 0.1% last month following a revised 1.8% May surge which was due to the first installment of the government's tax rebate checks being mailed out. During May, the government distributed $48.1 billion in economic stimulus checks. Last month, the government sent $27.9 billion worth of checks. The June gain in income exceeded Consensus expectations for a 0.2% decline. Excluding rebates income rose just 0.4%.
Disposable personal income fell 1.9% last
month after the 5.7% spike during May. Net taxes jumped 18.6% in June
following the 24.4% May decline.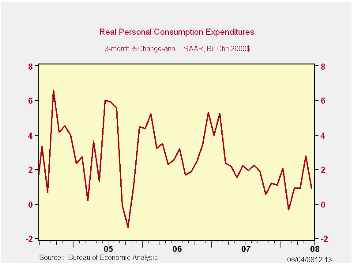
Wage & salary income rose a minimal 0.2% (4.5% y/y) after a 0.3% rise during May. These moderate increases reduced the annualized three-month growth in wages to 2.8% versus a 5.8% rise during 2007 and a 6.3% 2006 gain. Factory sector wages rose 0.1% (1.5% y/y) after a 0.2% May uptick. Wages & salaries in the private service-providing industries ticked up 0.2% (5.1% y/y). Wages in the government sector, however, have been strong and they posted a 0.5% (5.4% y/y) rise and three-month growth rose to 5.3%.
Interest income fell 0.7% (-1.8% y/y) and that was the ninth
consecutive month of decline. Year-to-year growth fell to -1.8% after a
7.9% rise during all of 2007. Dividend income rose 0.6% (8.4% y/y)
after a 12.4% rise last year and a 21.7% gain during 2006.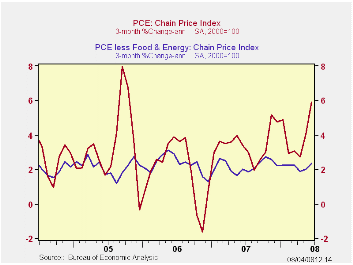
The PCE chain price index jumped 0.8% driven higher by rising energy prices. Some spillover to other prices may be apparent as the core PCE price index rose 0.3%. That exceeded Consensus forecasts for a 0.2% rise. Three-month growth in core prices rose to 2.3% from the recent low of 1.9%. Durable goods prices fell at a 2.0% rate during the last three months but services prices rose at an accelerated 4.3% annual rate.
Personal consumption expenditures rose another 0.6% after the 0.8% during May. Adjusted for price inflation, however, real spending fell 0.2% after a 0.3% May increase. Three-month growth in real spending amounted to just 0.9% (AR).
The personal savings rate halved versus May to 2.5% as a result of the rebate checks started being been spent.
The Changing Nature of the U.S. Balance of Payments from the Federal Reserve Bank of New York can be found here.
| Disposition of Personal Income (%) | June | May | Y/Y | 2007 | 2006 | 2005 |
|---|---|---|---|---|---|---|
| Personal Income | 0.1 | 1.8 | 5.7 | 6.1 | 7.1 | 5.6 |
| Disposable Personal Income | -1.9 | 5.7 | 7.6 | 5.5 | 6.4 | 4.4 |
| Personal Consumption | 0.6 | 0.8 | 5.3 | 5.5 | 5.9 | 6.2 |
| Saving Rate | 2.5 | 4.9 | 0.5 (June '07) | 0.5 | 0.7 | 0.3 |
| PCE Chain Price Index | 0.8 | 0.5 | 4.1 | 2.6 | 2.8 | 2.9 |
| Less food & energy | 0.3 | 0.2 | 2.3 | 2.2 | 2.3 | 2.1 |
by Tom Moeller August 4, 2008
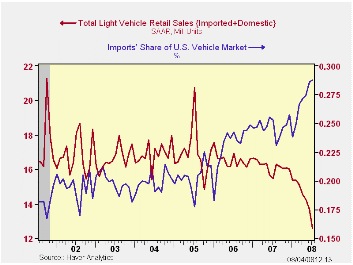
U.S. sales of light vehicles in July fell another 8.3% from June, according to the Autodata Corporation. The latest sales level of 12.55M units was the lowest since early-1992 and it pulled sales down 21.5% so far this year. The level of vehicle sales also was lower than Consensus expectations for sales of 13.7M.
Sales of domestically made light vehicles overall, at 8.94M, fell 8.5% last month from June and they were off 24.7% YTD. The level of domestic sales was at the lowest since January 1987.
The relatively fuel inefficient domestically made light trucks continued to feel most the effect of higher gasoline prices and sales fell 9.1% from June. That pulled the decline in sales since December to 32.3% and it left the level of light truck sales at the lowest since late-1992.
Sales of U.S. made cars also felt the effect of higher gas
prices. They about repeated their June decline with a 7.8% m/m drop to
4.35M units. Using data from Ward's Automotive News, that was lowest
level of car sales since the late 1950s.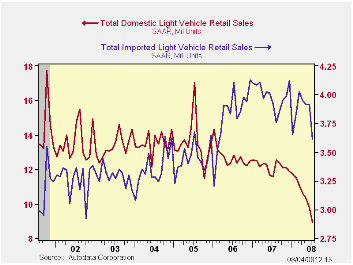
Sales of imported light vehicles also showed the effect of higher gasoline prices, and weaker consumer spending generally. They fell by 7.8% to 3.61 million after June's 0.1% uptick.
Sales of imported autos fell 9.0%, to 2.54M, after the revised 4.1% increase during June. Despite the monthly decline, sales of the relatively fuel efficient imported cars are up 1.9% year-to-year.
Not impervious to the rise in gasoline prices, sales of imported light trucks fell 5.0% (-24.5% y/y) last month while they were off 4.6% since December.
As a result of the greater decline in sales of U.S. made vehicles, import's share of the U.S. light vehicle market rose again to another record level of 28.8%. (Imported vehicles are those produced outside the U.S. and does not include vehicles with the nameplate of a foreign manufacturer produced within the U.S.) Imports' share of the U.S. car market ticked slightly lower from the June record to 36.9% while import's share of the light truck market rose to 18.9%, near the record of 19.3%.
U.S. auto exports on the rise from the Federal Reserve Bank of Chicago can be found here.
| Light Vehicle Sales (SAAR, Mil. Units) | July | June | Y/Y | 2007 | 2006 | 2005 |
|---|---|---|---|---|---|---|
| Total | 12.55 | 13.69 | -18.9% | 16.17 | 16.54 | 16.96 |
| Autos | 6.88 | 7.50 | -5.6 | 7.58 | 7.77 | 7.65 |
| Domestic | 4.35 | 4.72 | -9.5 | 5.07 | 5.31 | 5.40 |
| Imported | 2.54 | 2.79 | 1.9 | 2.51 | 2.45 | 2.25 |
| Light Trucks | 5.67 | 6.18 | -30.8 | 8.60 | 8.78 | 9.32 |
| Domestic | 4.59 | 5.05 | -32.1 | 7.12 | 7.42 | 8.12 |
| Imported | 1.07 | 1.13 | -24.5 | 1.48 | 1.37 | 1.20 |
by Tom Moeller August 4, 2008
Factory inventories surged 1.0% during June, thanks to the surge in oil prices. The value of inventories at petroleum refineries rose 9.5% (37.2% y/y) in June and the value is up by more than one-half since December as prices have surged. Less petroleum, factory inventories rose 0.4% (5.1% y/y) in June and YTD they rose 4.6%.
Less oil, the rate of inventory slowed. Automobile inventories
fell at a 31.7% annual rate during the last three months. Inventory
accumulation in the machinery sector also dropped to a 1.8% growth
rate. Accumulation in the computer & electronics areas fell as
well to a 1.0% rate of growth.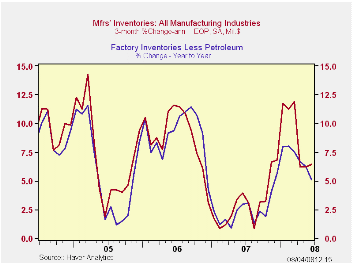
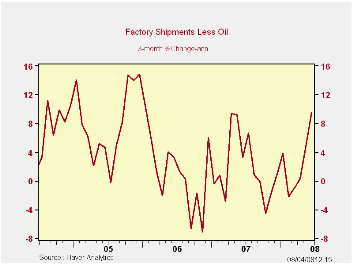
Factory shipments also surged, by 1.6%, due to oil. Shipments of petroleum surged by 5.6% (52.5% y/y). Less petroleum shipments rose (2.2% y/y) after a 0.5% May decline.
Total factory orders jumped by 1.7%, which was double expectations, again reflecting stronger petroleum orders (which equal shipments). Less petroleum, shipments did surge 1.0% (1.8% y/y) though the gain was making up for weakness earlier this year. Durable orders rose 0.8% which was the same as reported in the advance report, after a 0.1% May uptick.
Overall unfilled orders rose 0.9%, the same as they did in May. Order backlogs for civilian aircraft, which have been rising at a 25.3% rate, have started to cool. They were up just 0.4% in June Excluding the transportation sector altogether unfilled orders still rose 1.2% in June and at a 12.8% rate during the last three months. Accelerated growth in backlogs of machinery still account for much of that strength.
| Factory Survey (NAICS, %) | June | May | Y/Y | 2007 | 2006 | 2005 |
|---|---|---|---|---|---|---|
| Inventories | 1.0 | 0.6 | 7.0 | 3.7 | 6.4 | 8.9 |
| Excluding Transportation | 1.0 | 0.5 | 5.9 | 2.7 | 7.9 | 8.1 |
| New Orders | 1.7 | 0.9 | 7.1 | 1.9 | 6.2 | 11.9 |
| Excluding Transportation | 2.3 | 0.8 | 11.7 | 1.2 | 7.4 | 11.7 |
| Shipments | 1.6 | 0.3 | 7.5 | 1.2 | 5.9 | 10.4 |
| Excluding Transportation | 1.6 | 0.9 | 10.1 | 1.5 | 6.7 | 11.4 |
| Unfilled Orders | 0.9 | 0.9 | 15.3 | 17.1 | 15.3 | 15.4 |
| Excluding Transportation | 1.2 | 0.7 | 10.1 | 8.2 | 16.0 | 9.2 |
by Tom Moeller August 4, 2008
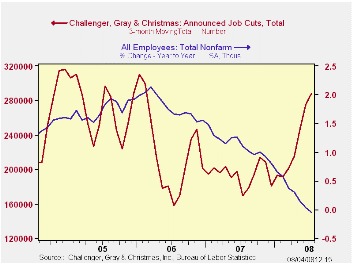
Job cut announcements during July recovered their June decline with a 26.4% m/m rise, according to the Challenger, Grey & Christmas survey. The three-month level layoffs rose further, to the highest level since early-2006.
A rise in the three-month average of job cut announcements in the financial, automotive, transportation and telecommunication sectors led the recent strength.
During the last ten years there has been a 76% (inverse) correlation between the three-month moving average of announced job cuts and the three-month change payroll employment.
Job cut announcements differ from layoffs. Many are achieved through attrition, early retirement or just never occur.
Challenger also reported that announced hiring plans rose sharply m/m but they were still down 90.2% y/y.
What Determines An Output Drop after an Energy Price Increase? Household or Firm Energy Share? by Rajeev Dhawan and Karsten Jeske for the Federal Reserve Bank of Atlanta and it is available here.
| Challenger, Gray & Christmas | July | June | Y/Y | 2007 | 2006 | 2005 |
|---|---|---|---|---|---|---|
| Announced Job Cuts | 103,312 | 81,755 | 140.8% | 768,264 | 839,822 | 1,072,054 |
by Louise Curley August 4, 2008
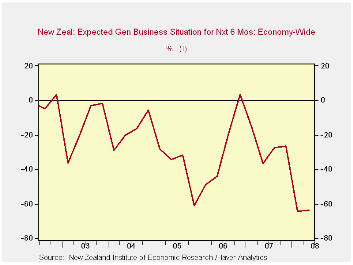
Shortly after the late June report of a first quarter 0.6% decline in New Zealand's Real Gross Domestic Product, the New Zealand Institute of Economic Research (NZIER) reported that its second quarter opinion survey showed that the pessimists on the outlook outweighed the optimists by 64%, the same balance as in the first quarter. (See the first chart).
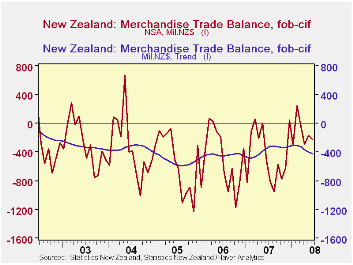
Seasonally unadjusted data on the trade balance showed a $NZ295 million improvement in June over June of last year. Exports were up $NZ 846 million and imports $NZ 550 million. The trade balance tends to vary considerably from month to month so that it is useful to look at the trend adjusted data, which at present is pointing downward, as can be seen in the second chart.
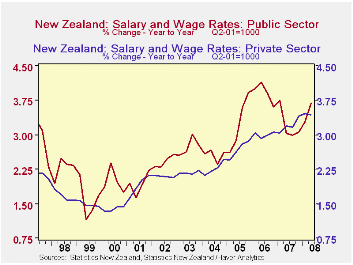
Public sector wages and salaries in New Zealand continued to rise in the second quarter of 2008, while wages and salaries in the private sector declined slightly. Wages and salaries in the public sector have generally increased faster than those in the private sector as can be seen in the third chart.
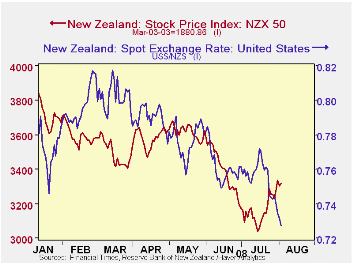
The exchange rate has depreciated 12% against the dollar from the peaks earlier this year and while the Stock Market declined by almost 25% from January 4 to July 15, it has since risen by 10%, as seen in the last chart.

Tom Moeller
AuthorMore in Author Profile »Prior to joining Haver Analytics in 2000, Mr. Moeller worked as the Economist at Chancellor Capital Management from 1985 to 1999. There, he developed comprehensive economic forecasts and interpreted economic data for equity and fixed income portfolio managers. Also at Chancellor, Mr. Moeller worked as an equity analyst and was responsible for researching and rating companies in the economically sensitive automobile and housing industries for investment in Chancellor’s equity portfolio. Prior to joining Chancellor, Mr. Moeller was an Economist at Citibank from 1979 to 1984. He also analyzed pricing behavior in the metals industry for the Council on Wage and Price Stability in Washington, D.C. In 1999, Mr. Moeller received the award for most accurate forecast from the Forecasters' Club of New York. From 1990 to 1992 he was President of the New York Association for Business Economists. Mr. Moeller earned an M.B.A. in Finance from Fordham University, where he graduated in 1987. He holds a Bachelor of Arts in Economics from George Washington University.
More Economy in Brief


