 Global| May 10 2007
U.S. Import Prices Up 1.3% M/M
Summary
Import prices jump by 1.3% as petroleum prices head higher by 6.5% in the month. Ex-petroleum import price rise by a cool 0.2%. Import prices are rising much more rapidly since March of 2006. Consumer goods import prices are up by [...]
Import prices jump by 1.3% as petroleum prices head higher by 6.5% in the month. Ex-petroleum import price rise by a cool 0.2%.
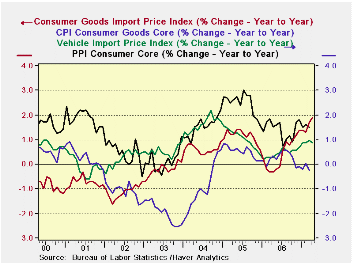
Import prices are rising much more rapidly since March of 2006. Consumer goods import prices are up by 1.8% Yr/Yr compared falling year over year one year ago- that’s an acceleration of 2 percentage points and that could become worrisome. The chart shows that the impact on consumer goods import prices is still on its upward trend. While that is a considerable net change for import price inflation, it is still a moderate rate of inflation overall for import prices, 1.8%. Still that pace has not ‘infected’ core consumer goods prices whose rate of change continues to plod along in a downtrend with Yr/yr gains near ZERO in March. Vehicle import prices also have picked up since March of last year as well; but they are only rising at 1% Yr/Yr with less than a 1% acceleration Yr/Yr. Domestic prices for consumer goods from the PPI report show that core prices are up by 1.6% Yr/Yr more than consumer prices but a step or two behind import prices. While the weaker dollar may be transmitting some clear inflation impulses, they are at the same time very mild and finding some resistance in getting into final consumer prices at all. On balance this is still good inflation news since the dollar has been week and the economy has fought–off the inflation transmission which itself has been only mildly present in import prices. 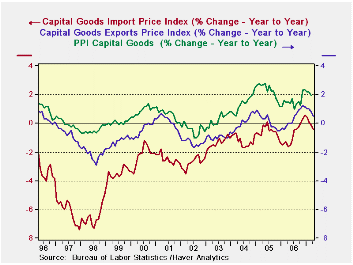
For capital goods prices the trends are curiously different. Inflation is being LED by domestic capital goods prices. While the pattern for export prices mimics that for US inflation in capital goods, export price inflation is below that for to domestically produced capital goods. Capital goods import prices are lower still but have begun to track more closely the US domestic and export measures. Capital goods inflation is generally trending although it is just above 2% domestically and half that for exports and near zero for imported capital goods. There is a hint of inflation abating for capital goods but the tailing trend is still quite recent.
The table of export and import prices trends lies below. It show that ex-petroleum price trends are not gathering momentum in general with the 3-mo inflation rate for them at 1.1% compared to 2.3% for six months and 2.9% for 12-Months. The trend for non-petroleum import prices is actually waning as petroleum import prices accelerate. Conversely non-agricultural export prices are clearly accelerating, but most of this reflects the inclusion of petroleum in industrial and supplies prices. That category is the only strongly accelerating one for non-Ag export prices.
On balance while there is some evidence of pressure on import prices, that pressure is muted and consumer goods are showing NO tendency to embrace any of the inflation from faster-rising import prices for consumer goods. Indeed, apart from oil, import prices that have accelerated over 12 months now are showing signs of deceleration.
| M/MO | SAAR | |||||
| IMPORTS | Apr-07 | Mar-07 | Feb-07 | 3-MO | 6-MO | 12-MO |
| ALL Imports | 1.3% | 1.5% | 0.4% | 13.3% | 7.2% | 1.9% |
| Excl Petrol | 0.2% | 0.3% | 0.0% | 1.9% | 3.7% | 2.9% |
| Petrol | 6.5% | 8.1% | 1.7% | 87.7% | 25.1% | -1.8% |
| Foods Feeds and Beverages | 1.4% | -0.2% | 0.2% | 6.2% | 8.9% | 8.8% |
| Industrial Supplies | 3.7% | 4.5% | 1.0% | 43.6% | 19.9% | 3.2% |
| Capital Goods | -0.4% | -0.2% | -0.3% | -3.9% | -1.5% | -0.4% |
| Motor Vehicles & Parts | 0.0% | 0.1% | 0.1% | 0.8% | 0.4% | 0.9% |
| Consumer goods excl autos | 0.1% | 0.1% | 0.0% | 0.8% | 1.6% | 1.9% |
| M/MO | SAAR | |||||
| EXPORTS | Apr-07 | Mar-07 | Feb-07 | 3-MO | 6-MO | 12-MO |
| ALL Exports | 0.3% | 0.6% | 0.8% | 7.3% | 6.6% | 4.9% |
| Agricultural | -1.3% | 2.0% | 2.8% | 15.0% | 24.0% | 19.0% |
| Non Agricultural | 0.4% | 0.5% | 0.6% | 6.6% | 5.3% | 3.9% |
| Foods Feeds and Beverages | -0.8% | 2.3% | 3.2% | 20.1% | 24.9% | 20.2% |
| Industrial Supplies | 1.3% | 1.7% | 2.0% | 22.2% | 15.4% | 10.2% |
| Capital Goods | -0.1% | -0.1% | 0.0% | -0.8% | 0.4% | 0.5% |
| Motor Vehicles & Parts | 0.1% | 0.1% | 0.1% | 1.1% | 1.3% | 1.3% |
| Consumer goods excl autos | 0.5% | 0.0% | 0.0% | 1.9% | 2.7% | 2.6% |

Robert Brusca
AuthorMore in Author Profile »Robert A. Brusca is Chief Economist of Fact and Opinion Economics, a consulting firm he founded in Manhattan. He has been an economist on Wall Street for over 25 years. He has visited central banking and large institutional clients in over 30 countries in his career as an economist. Mr. Brusca was a Divisional Research Chief at the Federal Reserve Bank of NY (Chief of the International Financial markets Division), a Fed Watcher at Irving Trust and Chief Economist at Nikko Securities International. He is widely quoted and appears in various media. Mr. Brusca holds an MA and Ph.D. in economics from Michigan State University and a BA in Economics from the University of Michigan. His research pursues his strong interests in non aligned policy economics as well as international economics. FAO Economics’ research targets investors to assist them in making better investment decisions in stocks, bonds and in a variety of international assets. The company does not manage money and has no conflicts in giving economic advice.
More Economy in Brief


