 Global| Oct 14 2009
U.S. Import Prices Tick Higher As Non-Oil Prices Firm
by:Tom Moeller
|in:Economy in Brief
Summary
Weakness in the U.S. dollar is pushing up non-oil import prices. Following the strength in oil prices earlier this year, now non-oil prices have firmed. U.S. import prices last month ticked up the expected 0.1% after jumps between [...]
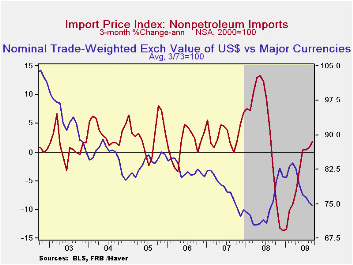
Weakness in the U.S. dollar is pushing up non-oil import prices. Following the strength in oil prices earlier this year, now non-oil prices have firmed. U.S. import prices last month ticked up the expected 0.1% after jumps between 1.0% and 3.0% during three of the prior four months.
The latest report showed that non-oil import prices rose 0.4%, which
was the strongest monthly increase since July of last year. On a
three-month basis, these prices have risen at a 1.9% annual rate after
declining at a 13.6% rate as of last December. (During the last ten
years, there has been a negative 81% correlation between the nominal
trade-weighted exchange value of the US dollar vs. major currencies and
the y/y change in non-oil import prices.)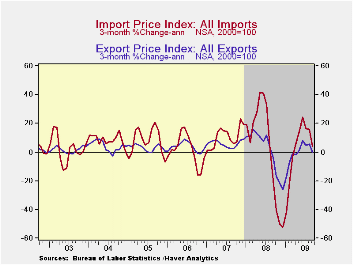
Import prices break down as follows: Food prices added 0.4% to a 1.3% August increase (-5.0% y/y). Capital goods prices broke from weakness with a 0.1% uptick which raised the three-month change to 0.4% following a 3.4% rate of decline in June. Prices for nonauto consumer goods also rose 0.1% (-1.0% y/y) and brought the three-month change to -1.1% from its weakest reading of -2.6% in January. Durable consumer goods prices were unchanged (-1.4% y/y) after two months of slight decline. Household goods rose slightly (-1.6% y/y) and furniture prices jumped 0.9% (-1.0% y/y). Apparel prices were unchanged for the second month (-1.1% y/y) but the three-month change improved to -0.4% from -4.3% six months ago.
The recent gain in petroleum prices took a breather last month and fell 1.1% after sharp increases during six of the prior seven months. This month, however, crude oil prices have found renewed strength and were up to $74.15 per barrel yesterday from a September average of $69.46.
Total export prices reversed some of their earlier strengthening with a fall of 0.3%. The drop was led by a 2.8% (-16.6% y/y) decline in agricultural prices. Nonagricultural export prices were unchanged and down 4.4% y/y.
The import and export price series can be found in Haver's USECON database. Detailed figures are available in the USINT database.
| Import/Export Prices (NSA, %) | September | August | July | Y/Y | 2008 | 2007 | 2006 |
|---|---|---|---|---|---|---|---|
| Import - All Commodities | 0.1 | 1.6 | -0.7 | -12.0 | 11.5 | 4.2 | 4.9 |
| Petroleum | -1.1 | 7.7 | -2.5 | -32.5 | 37.7 | 11.6 | 20.6 |
| Nonpetroleum | 0.4 | 0.3 | -0.2 | -5.4 | 5.3 | 2.7 | 1.7 |
| Export - All Commodities | -0.3 | 0.7 | -0.3 | -5.6 | 6.0 | 4.9 | 3.6 |

Tom Moeller
AuthorMore in Author Profile »Prior to joining Haver Analytics in 2000, Mr. Moeller worked as the Economist at Chancellor Capital Management from 1985 to 1999. There, he developed comprehensive economic forecasts and interpreted economic data for equity and fixed income portfolio managers. Also at Chancellor, Mr. Moeller worked as an equity analyst and was responsible for researching and rating companies in the economically sensitive automobile and housing industries for investment in Chancellor’s equity portfolio. Prior to joining Chancellor, Mr. Moeller was an Economist at Citibank from 1979 to 1984. He also analyzed pricing behavior in the metals industry for the Council on Wage and Price Stability in Washington, D.C. In 1999, Mr. Moeller received the award for most accurate forecast from the Forecasters' Club of New York. From 1990 to 1992 he was President of the New York Association for Business Economists. Mr. Moeller earned an M.B.A. in Finance from Fordham University, where he graduated in 1987. He holds a Bachelor of Arts in Economics from George Washington University.
More Economy in Brief


