 Global| Nov 13 2009
U.S. Import Prices Rise, Both Oil & Nonoil
by:Tom Moeller
|in:Economy in Brief
Summary
The U.S. economy is strengthening, so suggests price pressures in the foreign trade accounts. Overall import prices rose 0.7%, though the gain fell short of Consensus expectations for a 1.0% increase. The rise was led by a 0.9% [...]
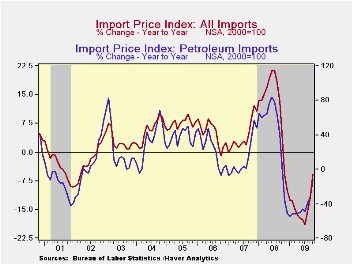
The U.S. economy is strengthening, so suggests price pressures
in the foreign trade accounts. Overall import prices rose 0.7%, though
the gain fell short of Consensus expectations for a 1.0% increase. The
rise was led by a 0.9% increase in petroleum prices which reversed a
like decline in September and promises to be followed by another strong
gain this month. The report indicated that non-oil import prices rose
0.7%, which was the strongest monthly increase since June of last year.
Moreover, on a three-month basis, these prices have risen at a 5.7%
annual rate after declining at a 13.6% rate as of last December.
(During the last ten years, there has been a negative 81% correlation
between the nominal trade-weighted exchange value of the US dollar vs.
major currencies and the y/y change in non-oil import prices.)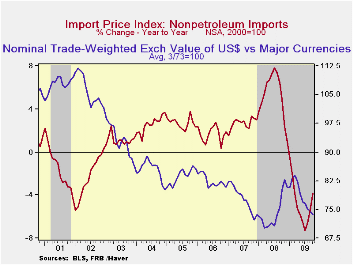
Import prices break down as follows: Chemical import prices
were quite strong and posted a 2.9% increase but they still were down
16.1% from last year. Iron & steel prices also were strong, up
2.4% m/m, but down by one-third from a year ago. Food prices increased
0.1% and at an 8.0% rate during the last three months. Capital goods
prices similarly posted a modest gain after five months of no change.
Prices for nonauto consumer goods rose 0.3% lifting the three-month
gain to 1.2% versus its weakest reading of -2.6% in January. Durable
consumer goods prices rose 0.4% (-0.9% y/y) but prices of household
goods slipped (-1.9% y/y) and furniture prices fell as well (-1.2%
y/y). Apparel prices were unchanged for the third month (-0.5% y/y).
Petroleum prices reversed their prior month's decline with a 0.9%
increase during October. This month crude oil prices have found further
strength with a rise to $76.94 yesterday from the October average of
$75.82 per barrel.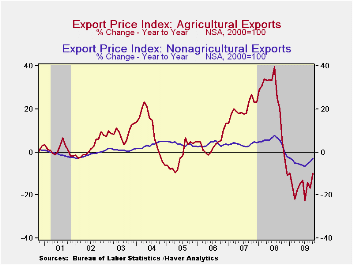
Total export prices resumed increasing modestly. The 0.3% rise was led by a 0.3% gain in nonagricultural export prices, down 2.7% y/y. Agricultural export prices actually fell 1.0% (-10.0% y/y).
The import and export price series can be found in Haver's USECON database. Detailed figures are available in the USINT database.
| Import/Export Prices (NSA, %) | October | September | August | Y/Y | 2008 | 2007 | 2006 |
|---|---|---|---|---|---|---|---|
| Import - All Commodities | 0.7 | 0.2 | 1.6 | -5.7 | 11.5 | 4.2 | 4.9 |
| Petroleum | 0.9 | -0.9 | 7.7 | -12.2 | 37.7 | 11.6 | 20.6 |
| Nonpetroleum | 0.7 | 0.4 | 0.3 | -3.8 | 5.3 | 2.7 | 1.7 |
| Export - All Commodities | 0.3 | -0.2 | 0.6 | -3.4 | 6.0 | 4.9 | 3.6 |

Tom Moeller
AuthorMore in Author Profile »Prior to joining Haver Analytics in 2000, Mr. Moeller worked as the Economist at Chancellor Capital Management from 1985 to 1999. There, he developed comprehensive economic forecasts and interpreted economic data for equity and fixed income portfolio managers. Also at Chancellor, Mr. Moeller worked as an equity analyst and was responsible for researching and rating companies in the economically sensitive automobile and housing industries for investment in Chancellor’s equity portfolio. Prior to joining Chancellor, Mr. Moeller was an Economist at Citibank from 1979 to 1984. He also analyzed pricing behavior in the metals industry for the Council on Wage and Price Stability in Washington, D.C. In 1999, Mr. Moeller received the award for most accurate forecast from the Forecasters' Club of New York. From 1990 to 1992 he was President of the New York Association for Business Economists. Mr. Moeller earned an M.B.A. in Finance from Fordham University, where he graduated in 1987. He holds a Bachelor of Arts in Economics from George Washington University.
More Economy in Brief


