 Global| Aug 10 2007
U.S. Import Prices Boosted in July By Oil
by:Tom Moeller
|in:Economy in Brief
Summary
A jump in petroleum prices, last month by 7.0%, again was the strength behind a 1.5% surge in overall July import prices. The surge was the largest since March and was ahead of Consensus expectations for a 1.1% increase. An 8.2% (4.2% [...]
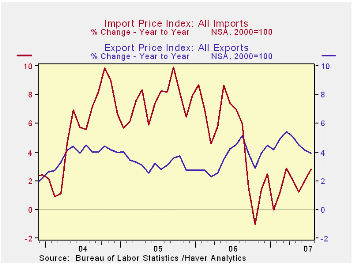
A jump in petroleum prices, last month by 7.0%, again was the strength behind a 1.5% surge in overall July import prices. The surge was the largest since March and was ahead of Consensus expectations for a 1.1% increase.
An 8.2% (4.2% y/y) rise in crude oil prices was behind the strength in petroleum prices, overall. Higher fuel oil prices also contributed with an 11.5% (9.3% y/y) spike. Early in August, a decline yesterday in the price of Brent crude oil to $69.97 from an average $76.97 during July promises a reversal of perhaps all the strength during that month.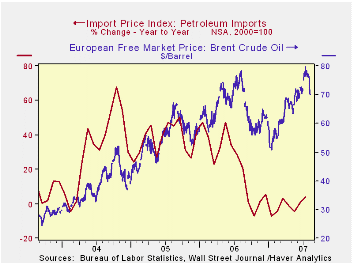
During the last ten years there has been a 66% (negative) correlation between the nominal trade-weighted exchange value of the US dollar vs. major currencies and the y/y change in non oil import prices. The correlation is a reduced 47% against a broader basket of currencies. Why a Dollar Depreciation May Not Close the U.S. Trade Deficit from the Federal Reserve Bank of New York is available here
Prices for industrial supplies & materials excluding petroleum fell 0.1% (+8.3% y/y). Paper & paper base stock prices fell 0.3% (-1.3% y/y) and metal prices fell 0.3% (+16.4% y/y). Building material prices rose 2.7% (-0.6 y/y). These detailed import price series can be found in the Haver USINT database. 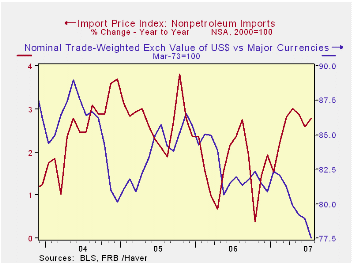
Capital goods prices rose 0.2% (0.1% y/y) for the second month, led down again by a 0.2% (-5.9% y/y) drop in computers, peripheral and semiconductors. Less the high tech sector, capital goods prices rose a strong 0.4% (2.6% y/y) for the second month.
Prices for imported non-manufactured consumer goods were firm with a 0.5% ( 3.2% y/y) rise. Prices for most other nonauto consumer goods were little changed, except apparel prices which rose 0.3% (1.2% y/y).
Overall export prices rose 0.2% and the 3.9% y/y gain was the weakest since November of last year. Agricultural prices rose 1.5% (17.8% y/y) but nonagricultural export prices were unchanged (+2.8% y/y).
Today's statement by the Federal Reserve on Providing Liquidity to Financial Markets can be found here.
| Import/Export Prices (NSA) | July | June | Y/Y | 2006 | 2005 | 2004 |
|---|---|---|---|---|---|---|
| Import - All Commodities | 1.5% | 0.9% | 2.8% | 4.8% | 7.5% | 5.6% |
| Petroleum | 7.0% | 4.4% | 4.1% | 20.6% | 37.6% | 30.5% |
| Non-petroleum | 0.2% | 0.1% | 2.8% | 1.7% | 2.7% | 2.6% |
| Export- All Commodities | 0.2% | 0.3% | 3.9% | 3.6% | 3.2% | 3.9% |

Tom Moeller
AuthorMore in Author Profile »Prior to joining Haver Analytics in 2000, Mr. Moeller worked as the Economist at Chancellor Capital Management from 1985 to 1999. There, he developed comprehensive economic forecasts and interpreted economic data for equity and fixed income portfolio managers. Also at Chancellor, Mr. Moeller worked as an equity analyst and was responsible for researching and rating companies in the economically sensitive automobile and housing industries for investment in Chancellor’s equity portfolio. Prior to joining Chancellor, Mr. Moeller was an Economist at Citibank from 1979 to 1984. He also analyzed pricing behavior in the metals industry for the Council on Wage and Price Stability in Washington, D.C. In 1999, Mr. Moeller received the award for most accurate forecast from the Forecasters' Club of New York. From 1990 to 1992 he was President of the New York Association for Business Economists. Mr. Moeller earned an M.B.A. in Finance from Fordham University, where he graduated in 1987. He holds a Bachelor of Arts in Economics from George Washington University.
More Economy in Brief


