 Global| Mar 16 2010
U.S. Housing StartsDecline
by:Tom Moeller
|in:Economy in Brief
Summary
There's plainly no lift beneath the housing market. Housing starts last month fell 5.9% to 575,000 units (AR) and reversed January's upwardly-revised gain. Heavy snowstorms likely were a factor contributing to the decline which fell [...]
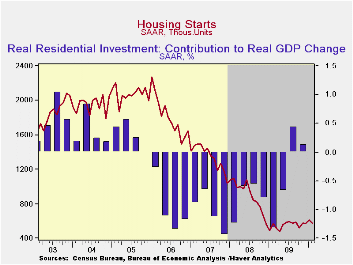
There's plainly no lift beneath the housing market. Housing starts last month fell 5.9% to 575,000 units (AR) and reversed January's upwardly-revised gain. Heavy snowstorms likely were a factor contributing to the decline which fell slightly short of Consensus expectations for 570,000 starts.But the lack of forward momentum is further evident in the unchanged level of starts versus one year ago.
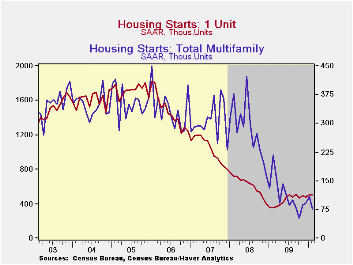
Fewer starts of multi-family units accounted for most of the decline in February activity. Starts of apartments, condominiums & town houses fell by nearly one-third from January and were off by two-thirds y/y. Perhaps some sign of a bottoming is that starts during this quarter roughly equal 4Q '09.
Starts of single-family homes didn't quite show that lack of forward momentum. They fell just 0.6% for the month after a 4.4% January increase. What's more starts have risen nearly 40% from the recession low twelve months ago. But they have languished near the current level since mid-2009. Evidence that weather was a factor behind last month's decline is mixed based on the regional figures. Single-family starts fell 14.0% m/m in the Northeast (+32.4%) after a 21.3% January gain but in the Midwest, which also was socked by storms, single-family starts rose 20.8% from January (72.2% y/y). Starts in the South fell 5.7% (+21.0% y/y), a decline at least partially due to storms, and they rose 3.8% (78.7% y/y) in the West.
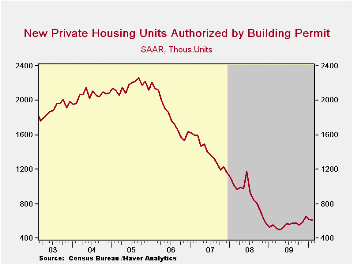
During February, building permits fell another 1.6% after a 4.7% January decline. Permits to build a single-family home matched the January dip of 0.2% (+32.0% y/y) while starts of 2-4 unit homes were up slightly m/m and y/y. Permits for 5+ unit structures seem to have found a bottom after the earlier decline of three-quarters.
| Housing Starts (000s, SAAR) | February | January | December | Feb. Y/Y | 2009 | 2008 | 2007 |
|---|---|---|---|---|---|---|---|
| Total | 575 | 611 | 573 | 0.2% | 553 | 900 | 1,342 |
| Single-Family | 499 | 502 | 481 | 39.8 | 440 | 616 | 1,036 |
| Multi-Family | 76 | 109 | 92 | -65.0 | 113 | 285 | 306 |
| Building Permits | 612 | 622 | 653 | 11.3 | 558 | 895 | 1,392 |
by Tom Moeller March 16, 2010
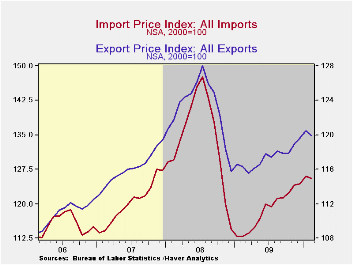
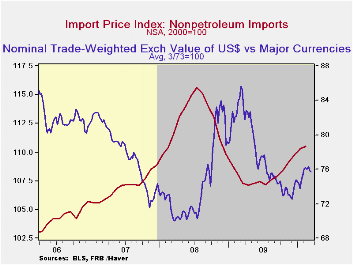
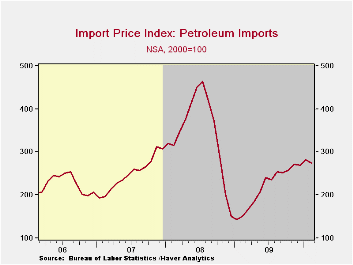
Earlier gains in import prices took a breather in February. However, a further increase is likely this month with the rise in oil prices. The Bureau of Labor Statistics indicated that last month import prices slipped 0.3% and roughly matched Consensus expectations for a 0.2% decline. Excluding petroleum import prices gained 0.2% which was down sharply from the increases during the prior four months.
Petroleum prices slipped 2.2% last month following their 4.4% January increase. That moderation, however, is proving to be short-lived. Brent crude oil prices in March have strengthened to nearly $80 per barrel from $74 last month.
For non-oil imports, the price gain moderated last month to 0.2% after gains of 0.5%-to-0.6%. The lower value of the dollar has now helped lift these prices at a 5.2% annual rate during the last three months following the 4.1% decline last year. (During the last ten years, there has been a negative 81% correlation between the nominal trade-weighted exchange value of the US dollar vs. major currencies and the y/y change in non-oil import prices.)
Food & beverage prices slipped 0.1% (+5.4% y/y) while prices for nonauto consumer goods also slipped 0.1%. They were unchanged y/y. That compares with a 1.0% y/y decline this past summer. The unchanged reading reflected a 0.6% increase in durable consumer goods prices after the 0.6% 2009 dip. Auto import prices rose a steady 0.6% y/y. Home entertainment equipment prices rose 0.8% after declining steadily since 1996. In contrast, household goods prices fell 1.1% y/y which was double the rate of decline last year. Finally, apparel prices were unchanged m/m as they were for all of last year.Capital goods fell 0.1% last month (-0.7% y/y) and excluding computers prices also fell 0.1% both m/m and y/y.
Total export prices slipped 0.5% last month and reversed the January gain. The decline reflected a 3.8% drop in agricultural export prices (+2.3% y/y) and a 0.2% drop in non-agricultural goods prices (+3.3% y/y).
| Import/Export Prices (NSA, %) | February | January | December | Feb. Y/Y | 2009 | 2008 | 2007 |
|---|---|---|---|---|---|---|---|
| Import - All Commodities | -0.3 | 1.3 | 0.2 | 11.2 | -11.5 | 11.5 | 4.2 |
| Petroleum | -2.2 | 4.4 | -1.1 | 81.3 | -35.9 | 37.7 | 11.6 |
| Nonpetroleum | 0.2 | 0.5 | 0.5 | 2.1 | -4.1 | 5.3 | 2.7 |
| Export - All Commodities | -0.5 | 0.7 | 0.7 | 3.1 | -4.6 | 6.0 | 4.9 |
by Tom MoellerMarch 16, 2010
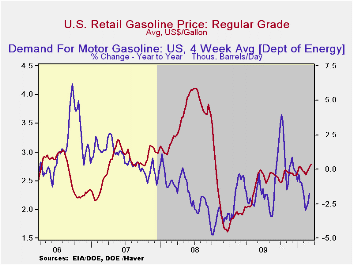
Petroleum prices are on the rise with the improved economy. The pump price for regular gasoline rose another four cents last week to $2.79 per gallon which is up by three-quarters since December of 2008. Yesterday, the spot market price for a gallon of regular gasoline reversed a piece of that increase and fell by three cents. The figures are reported by the U.S. Department of Energy and can be found in Haver's WEEKLY & DAILY databases.
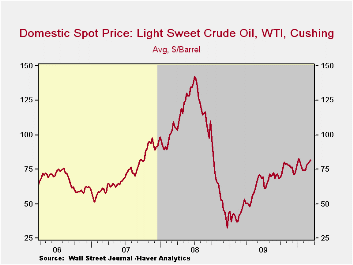
The price for a barrel of light sweet crude (WTI) rose last week to $81.76 though it remained down slightly from the early-January high of $82.59. Prices have risen from $71.53 early this past December and are more than double the December 2008 low of $32.37. Yesterday, the upward trend eased and the spot price fell to $79.80.
Demand for gasoline fell 1.8% last week versus one year ago. That decline compared to a 3.9% increase at the beginning of October. The demand for residual fuel oil spiked by one-third with falling temperatures in the Northeast & Midwest. However, distillate demand fell 6.1% y/y, a decline more moderate than the 21.6% y/y shortfall at the beginning of last July. Inventories of crude oil and petroleum products slipped in early-March and were roughly unchanged from one year ago.
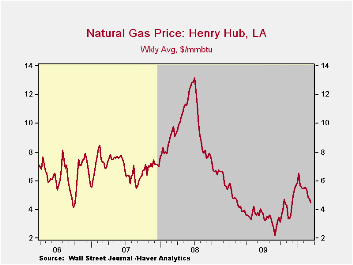
U.S. natural gas prices fell further last week to an average $4.46 per mmbtu (+14.9% y/y) despite heavy snow storms through much of the U.S. Prices reached a high of $6.50 early in January. Nevertheless, prices remained double the September low.
| Weekly Prices | 03/15/10 | 03/08/10 | 03/01/10 | Y/Y | 2009 | 2008 | 2007 |
|---|---|---|---|---|---|---|---|
| Retail Regular Gasoline ($ per Gallon, Regular) | 2.79 | 2.75 | 2.70 | 46.0% | 2.35 | 3.25 | 2.80 |
| Light Sweet Crude Oil, WTI ($ per bbl.) | 81.76 | 80.19 | 79.26 | 79.0% | 61.39 | 100.16 | 72.25 |
by Louise Curley March 16, 2010
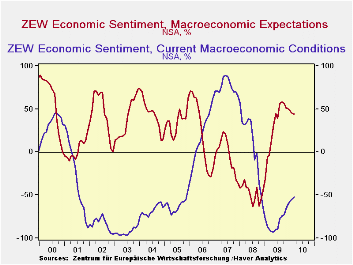
The ZEW March survey of German institutional investors and analysts shows that they are a little more cautious regarding macroeconomic expectations. The excess of optimists over pessimist declined by 0.6 percentage points from 45.1% in February to 44.5% in March. This is the sixth monthly decline from the high point of 57.7% reached last September. The participants are slightly less pessimistic about current conditions than they were in February. The excess of pessimists declined 2.9 percentage points from 54.8% to 51.9% in March. The attached chart shows the appraisals of the German financial community of macroeconomic conditions and expectations
The improvement in their appraisal of current conditions and their improved expectations for profits in each of the industries surveyed (as can be seen in the table below) suggest that something else has been bothering the participants in the survey in their causing them to lower their macroeconomic expectations. No doubt the problems in Greece have been of particular concern to the financial types that make up the participants in the ZEW survey and have affected their macroeconomic expectations adversely. The survey was conducted between March 1 and March 15, a period in which there was a great deal of uncertainly about the measures the European Union might take in dealing with its debt-ridden member. It was not until the last day, March 15, that the finance ministers of the Euro Area announced that they had devised a plan for emergency loans to Greece in the event that the tax increases and wage cuts Greece has undertaken fail to prevent fiscal disaster. While there has been some relief that a plan has been worked out, the details of the plan are yet to be revealed. Greece's problems are likely to continue to cast shadows on the macroeconomic expectations of the ZEW participants.
| ZEW SURVEY (% balance) | Mar 10 | Feb 10 | Mar 09 | M/M Chg | Y/Y Chg | 2009 | 2008 | 2007 |
|---|---|---|---|---|---|---|---|---|
| Macroeconomic Expectations | 44.5 | 45.1 | -3.5 | -0.6 | 48.0 | 29.9 | 47.5 | -3.0 |
| Macroeconomic Conditions | -51.9 | -54.8 | -89.4 | 2.9 | 37.5 | -80.5 | 7.3 | 75.9 |
| Profit Expectations | ||||||||
| Banks | 18.8 | 15.8 | -31.6 | 3.0 | 50.4 | 6.2 | -59.5 | -3.5 |
| Insurance | 12.4 | 11.0 | -34.2 | 1..4 | 46.6 | -3.6 | -45.4 | 9.7 |
| Vehicles/automotive | -25.4 | -29.7 | -70.2 | 4.3 | 44.8 | -50.3 | -55.6 | 8.6 |
| Chemicals/Pharmaceutical | 40.6 | 35.8 | -49.6 | 4.8 | 90.2 | -8.1 | -8.6 | 35.3 |
| Steel/metal | 28.3 | 23.8 | -64.1 | 4.5 | 92.4 | -21.4 | -19.4 | 25.5 |
| Electronics | 29.8 | 22.0 | -57.2 | 7.8 | 87.0 | -19.8 | -16.8 | 29.1 |
| Machinery | 36.7 | 29.6 | -69.4 | 7.1 | 106.1 | -26.6 | -14.1 | 54.5 |
| Consumption/trade | -15.6 | -18.9 | -40.2 | 3.3 | 24.6 | -32.9 | -37.9 | 16.1 |
| Construction | 4.8 | 4.2 | -30.5 | 0.6 | 35.3 | -12.5 | -41.5 | 18.5 |
| Utilities | 23.0 | 21.4 | -17.6 | 1.6 | 40.6 | 4.4 | 5.5 | 11.6 |
| Services | 24.0 | 22.1 | -28.6 | 1.9 | 52.6 | -5.0 | -4.8 | 35.9 |
| Telecommunications | 9.3 | 6.4 | -16.1 | 2.9 | 25.4 | -7.7 | -16.9 | -12.3 |
| Information technology | 36.9 | 33.5 | -33.6 | 3.4 | 705 | -3.5 | -2.7 | 32.6 |

Tom Moeller
AuthorMore in Author Profile »Prior to joining Haver Analytics in 2000, Mr. Moeller worked as the Economist at Chancellor Capital Management from 1985 to 1999. There, he developed comprehensive economic forecasts and interpreted economic data for equity and fixed income portfolio managers. Also at Chancellor, Mr. Moeller worked as an equity analyst and was responsible for researching and rating companies in the economically sensitive automobile and housing industries for investment in Chancellor’s equity portfolio. Prior to joining Chancellor, Mr. Moeller was an Economist at Citibank from 1979 to 1984. He also analyzed pricing behavior in the metals industry for the Council on Wage and Price Stability in Washington, D.C. In 1999, Mr. Moeller received the award for most accurate forecast from the Forecasters' Club of New York. From 1990 to 1992 he was President of the New York Association for Business Economists. Mr. Moeller earned an M.B.A. in Finance from Fordham University, where he graduated in 1987. He holds a Bachelor of Arts in Economics from George Washington University.
More Economy in Brief


