 Global| Nov 20 2007
U.S. Housing Starts Total Up Unexpectedly; Single Family & Permits Down
by:Tom Moeller
|in:Economy in Brief
Summary
Overall, good weather helped housing starts to post a surprising 3.0% m/m gain in October to 1.229M units. Consensus expectations had been for little change at 1.20M starts and the prior month's level was little revised. The surprise [...]
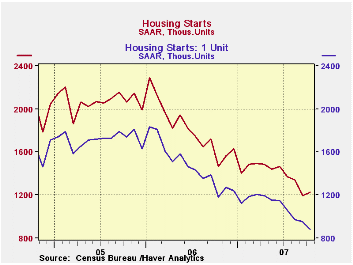
Overall, good weather helped housing starts to post a surprising 3.0% m/m gain in October to 1.229M units. Consensus expectations had been for little change at 1.20M starts and the prior month's level was little revised.
The surprise was that starts of multi-family structures recovered virtually all the prior month's plunge with a 44.4% rebound. It was from the lowest level since 1994.
Single-family starts continued downward for the seventh
consecutive month with a 7.3% m/m decline. At 884M units single family
starts fell to their lowest since 1991, off by more than one-half from
the peak early last year.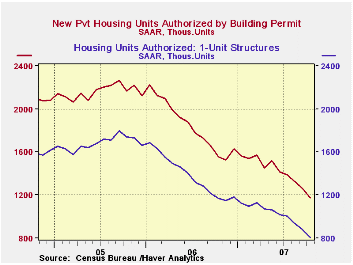
By region, single family starts in the South suffered the worst m/m drop in a year with a 19.5% fall, down 56% from the 2006 peak. In the West single family starts fell 8.1% m/m but starts are off nearly two-thirds from the 2005 peak level. In the Midwest starts rose 15.% to finish 48% below the 2006 peak and single family starts in the Northeast rose for the second consecutive month with a 29.5% rise, but they're still 42% below the recent peak.
Continuing with downward momentum, building permits fell 6.6% (-24.5% y/y) for the fifth straight m/m decline. Single-family permits fell 8.0% (-31.0% y/y) and multi-family permits fell as well.
Asset Price Bubbles from the Federal Reserve Bank of San Francisco is available here.
| Housing Starts (000s, AR) | Oct | Sept | Y/Y | 2006 | 2005 | 2004 |
|---|---|---|---|---|---|---|
| Total | 1,229 | 1,193 | -16.4% | 1,812 | 2,073 | 1,950 |
| Single-Family | 884 | 954 | -25.1% | 1,474 | 1,719 | 1,604 |
| Multi-Family | 345 | 239 | 9.4% | 338 | 354 | 345 |
| Building Permits | 1,178 | 1,261 | -24.5% | 1,842 | 2,159 | 2,058 |
by Robert Brusca November 20, 2007
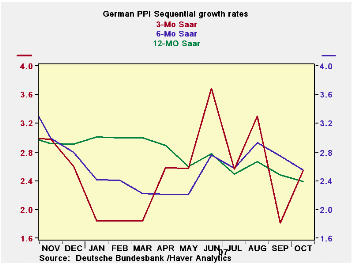
We are hearing more concerns about inflation not just inflation risk from Euro area officials. Germany has its core PPI heading lower and the headline as well but not in a clear cut way. Also the declines are slow and energy prices are still threatening. Germany has not had its year/year PPI core rate below 2% since April of 2006 when it rose by 1.8%. The Bundesbank has been issuing such warnings especially Weber. Today Austrian CB president Liebscher says that the harmonized CPI is ‘striking me with concern.’ At the same time groups like the German engineering Association warn of the impact of a too strong euro on the economy. These very clear, well founded, and completely opposite concerns put the ECB in a tough spot.
| Germany PPI | |||||||
|---|---|---|---|---|---|---|---|
| %m/m | %-SAAR | ||||||
| Oct-07 | Sep-07 | Aug-07 | 3-mo | 6-mo | 12-mo | 12-moY-Ago | |
| MFG | 0.4% | 0.1% | 0.2% | 2.7% | 2.4% | 1.7% | 4.6% |
| Ex Energy | 0.3% | 0.0% | 0.4% | 2.5% | 2.6% | 2.4% | 3.0% |
| Core: ex food beverages, tobacco & Petroleum | |||||||
by Robert Brusca November 20, 2007
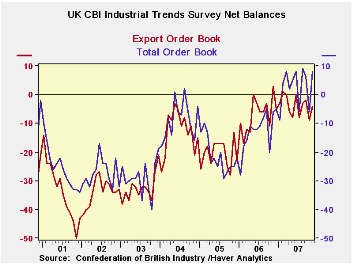
UK orders jumped to a net balance reading of +8 from -6 in October. The series has been somewhat see-saw as the chart on the left shows. Export orders, also showing some see-saw movement, are nonetheless rather better behaved and showing a clearer trend move lower. Output volume has been moving to lower readings but that net balance response continues to be at a firm, positive, +9. The price reading shows an unwelcome +21, its strongest reading in a while.
| UK Industrial Volume Data CBI Survey | |||||||||
|---|---|---|---|---|---|---|---|---|---|
| Reported: | Nov 07 |
Oct 07 |
Sep 07 |
Aug 07 |
12MO Avg | Pctile | Max | Min | Range |
| Total Orders | 8 | -6 | 6 | 9 | 2 | 98% | 9 | -40 | 49 |
| Export Orders | -4 | -9 | -2 | -3 | -4 | 87% | 3 | -50 | 53 |
| Stocks:Finished Goods | 14 | 14 | 7 | 9 | 10 | 57% | 26 | -2 | 28 |
| Output Volume: Next 3M | 9 | 10 | 17 | 13 | 16 | 66% | 28 | -28 | 56 |
| Avg Prices 4Nxt 3m | 21 | 14 | 16 | 16 | 17 | 93% | 25 | -30 | 55 |
by Robert Brusca November 20, 2007
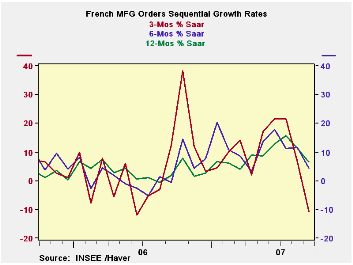
We continue to monitor order trends. Trends for France are still higher over 12 months at +6.4%. Foreign orders are a half step behind at +5.5%. But over six months the growth rate is lower and over three months the growth rate is negative for both overall and foreign orders. Total and foreign orders are lower in two of the most recent three months.
The French economy has been losing momentum and now it is beset with strikes. These are in sharp contrast with the post election enthusiasm that kept sentiment strong well after the elections. The prospect of change was invigorating; the reality of what it will really mean appears to be disappointing. That swing from euphoria to worker strikes could do damage to the economy. The strong Euro has played a role in the slowing of the economy as well as throughout the Euro area. Sarkozy has his work cut out for him.
| French Orders | ||||||
|---|---|---|---|---|---|---|
| Saar exept m/m | Sep-07 | Aug-07 | Jul-07 | 3-mo | 6-mo | 12-mo |
| Total | -2.3% | -1.0% | 0.5% | -10.7% | 4.2% | 6.4% |
| Foreign | -3.1% | 0.5% | -1.2% | -14.5% | 2.1% | 5.5% |
by Robert Brusca November 20, 2007
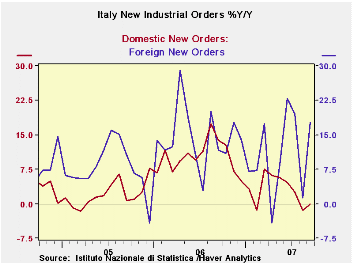
Italy’s order trends are not as clear as the slowing in some other Euro area countries. True, the 3-month growth rates are lower and sharply lower especially for foreign orders. But the chart on the left shows how erratic foreign orders have been. Domestic orders that have slowed by less are negative and in a clearer slowdown mode. On balance Italy’s pattern looks as though its showdown is of domestic, not of foreign, origin. Domestic orders have been weak and are now in negative territory. Sales, which have been relatively firmer and even accelerated in the recent three months, fell sharply in September after a strong rise in August. Orders give us a clearer picture of slowing growth in Italy. The foreign sector is unclear. But domestic orders are sending a pretty clear message of slowdown in progress.
| Italy Orders | ||||||
|---|---|---|---|---|---|---|
| Saar exept m/m | Sep-07 | Aug-07 | Jul-07 | 3-mo | 6-mo | 12-mo |
| Total | 0.3% | -0.8% | -0.6% | -4.1% | 6.3% | 5.9% |
| Foreign | 5.7% | -4.0% | -3.5% | -8.1% | 15.7% | 17.8% |
| Domestic | -2.7% | 1.1% | 1.1% | -2.1% | 1.3% | 0.0% |
| Memo: | ||||||
| Sales | -3.6% | 4.0% | 1.3% | 6.7% | 3.8% | 5.9% |

Tom Moeller
AuthorMore in Author Profile »Prior to joining Haver Analytics in 2000, Mr. Moeller worked as the Economist at Chancellor Capital Management from 1985 to 1999. There, he developed comprehensive economic forecasts and interpreted economic data for equity and fixed income portfolio managers. Also at Chancellor, Mr. Moeller worked as an equity analyst and was responsible for researching and rating companies in the economically sensitive automobile and housing industries for investment in Chancellor’s equity portfolio. Prior to joining Chancellor, Mr. Moeller was an Economist at Citibank from 1979 to 1984. He also analyzed pricing behavior in the metals industry for the Council on Wage and Price Stability in Washington, D.C. In 1999, Mr. Moeller received the award for most accurate forecast from the Forecasters' Club of New York. From 1990 to 1992 he was President of the New York Association for Business Economists. Mr. Moeller earned an M.B.A. in Finance from Fordham University, where he graduated in 1987. He holds a Bachelor of Arts in Economics from George Washington University.
More Economy in Brief


