 Global| Apr 16 2021
U.S. Housing Starts Surge in March to Highest Level Since June 2006
by:Tom Moeller
|in:Economy in Brief
Summary
• Starts rebound after harsh winter weather limited building activity. • Single-family & multi-family starts rise sharply. • Building permits increase moderately. Better weather and low interest rates boosted housing last month. [...]
• Starts rebound after harsh winter weather limited building activity.
• Single-family & multi-family starts rise sharply.
• Building permits increase moderately.
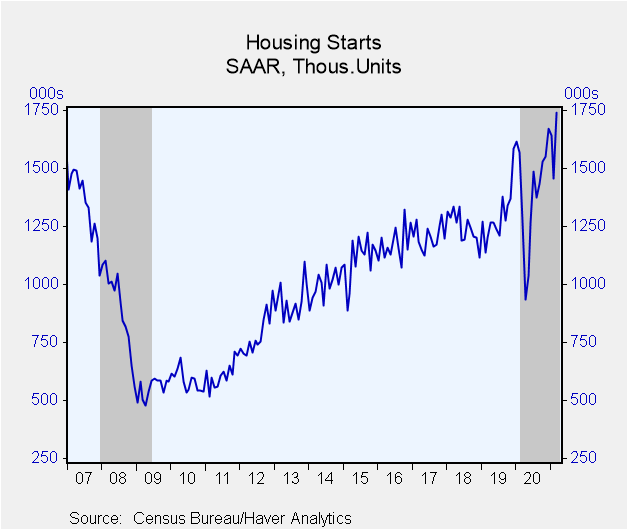
Better weather and low interest rates boosted housing last month. Housing starts jumped 19.4% (37.0% y/y) during March to 1.739 million units (SAAR) after falling 11.3% in February to 1.457 million, revised from 1.421 million. Starts in January eased 1.7% to 1.642 million, revised from 1.584 million. The Action Economics Forecast Survey expected 1.610 million starts in March.
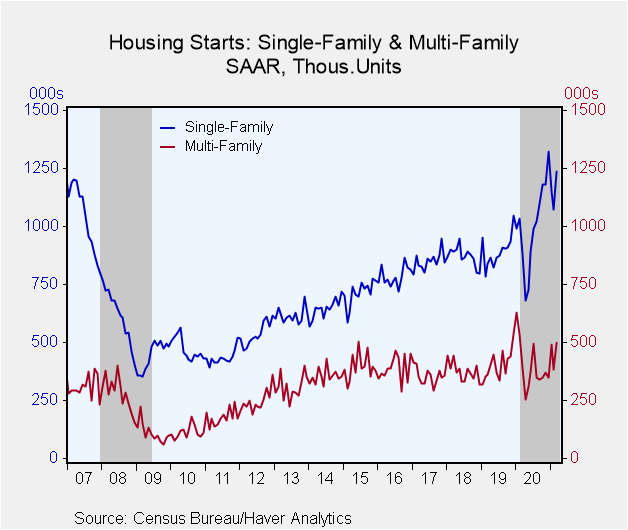
Starts of single-family homes jumped 15.3% in March (40.7% y/y) to 1.238 million from 1.074 million in February, revised from 1.040 million. Starts of multi-family units surged 30.8% last month (28.8% y/y) to 501,000 from 383,000, revised from 381,000.
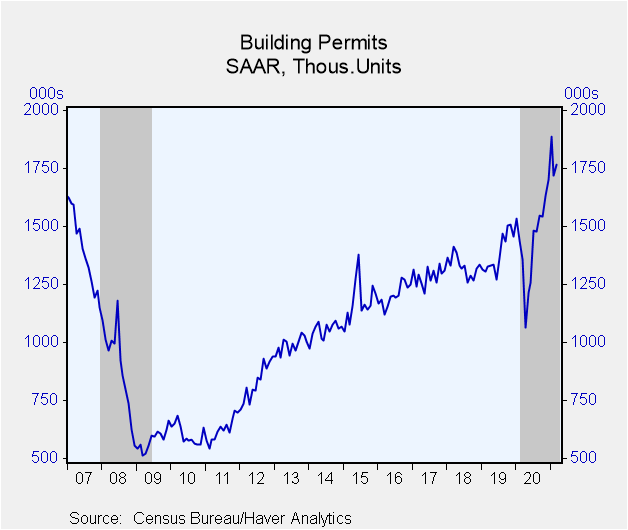
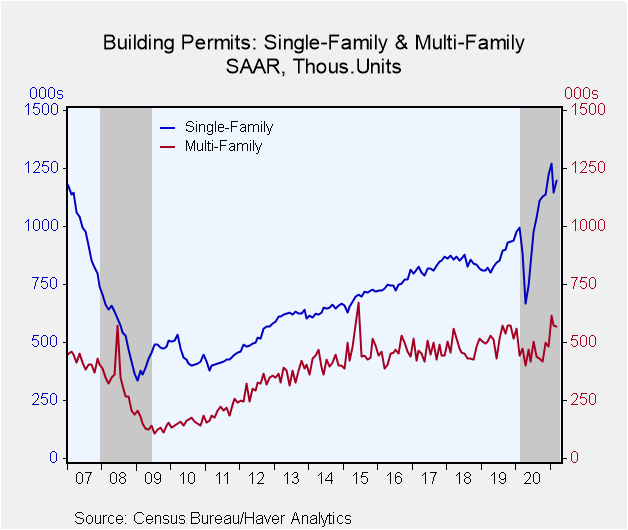
Building permits improved 2.7% (30.2% y/y) to 1.766 million from 1.720 million in February, revised from 1.682 million. That reversed part of the February decline. Permits to build single-family homes rose 4.6% (33.6% y/y) to 1.199 million after falling 9.8% in February. Permits to build multi-family homes eased 1.2% (+20.1% y/y) to 567,000 after a 6.8% February decline.
By region, housing starts in the Northeast jumped by roughly two-thirds and more than doubled y/y to 182,000 after falling 46.1% in February. In the Midwest, starts surged 122.8% (87.0% y/y) to 303,000, the highest level since February 2006. Housing starts in the South rose 13.5% (24.0% y/y) to 874,000 following February's 6.2% decline. In the West, starts fell 13.6% (+19.5% y/y) to 380,000 after rising 8.9% during February.
The housing starts and permits figures can be found in Haver's USECON database. The expectations figure is contained in the AS1REPNA database.
| Housing Starts (000s, SAAR) | Mar | Feb | Jan | Mar Y/Y % | 2020 | 2019 | 2018 |
|---|---|---|---|---|---|---|---|
| Total | 1,739 | 1,457 | 1,642 | 37.0 | 1,395 | 1,295 | 1,248 |
| Single-Family | 1,238 | 1,074 | 1,152 | 40.7 | 1,000 | 893 | 872 |
| Multi-Family | 501 | 383 | 490 | 28.8 | 396 | 403 | 376 |
| Starts By Region | |||||||
| Northeast | 182 | 111 | 206 | 116.7 | 113 | 115 | 111 |
| Midwest | 303 | 136 | 211 | 87.0 | 193 | 170 | 170 |
| South | 874 | 770 | 821 | 24.0 | 741 | 689 | 630 |
| West | 380 | 440 | 404 | 19.5 | 348 | 322 | 337 |
| Building Permits | 1,766 | 1,720 | 1,886 | 30.2 | 1,438 | 1,386 | 1,329 |
Tom Moeller
AuthorMore in Author Profile »Prior to joining Haver Analytics in 2000, Mr. Moeller worked as the Economist at Chancellor Capital Management from 1985 to 1999. There, he developed comprehensive economic forecasts and interpreted economic data for equity and fixed income portfolio managers. Also at Chancellor, Mr. Moeller worked as an equity analyst and was responsible for researching and rating companies in the economically sensitive automobile and housing industries for investment in Chancellor’s equity portfolio. Prior to joining Chancellor, Mr. Moeller was an Economist at Citibank from 1979 to 1984. He also analyzed pricing behavior in the metals industry for the Council on Wage and Price Stability in Washington, D.C. In 1999, Mr. Moeller received the award for most accurate forecast from the Forecasters' Club of New York. From 1990 to 1992 he was President of the New York Association for Business Economists. Mr. Moeller earned an M.B.A. in Finance from Fordham University, where he graduated in 1987. He holds a Bachelor of Arts in Economics from George Washington University.


