 Global| Mar 20 2007
U.S. Housing Starts Rise in February
Summary
Inflation, as measured by the year over year increase in the Consumer Price Index (CPI) was 2.78%, nine basis point over January, but still below December's high of 2.97%. This is the measure that the Bank of England focuses on in [...]
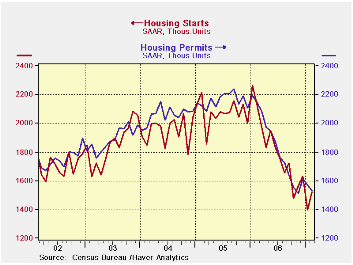 U.S. housing starts rose 9.0% in February, as they regained ground lost after a 14.3% decline in January, the Commerce Department reported Tuesday. Housing starts are off 28.5% year-over-year in February. Yet some regions show gains… Increases are concentrated in the South (+18.0%) and West (+26.4%) where milder weather helped recovery from similar declines in the prior month. The regions we expect to be more afflicted by bad weather show exactly that: the Northeast (-29.7%) and Midwest (-14.4%); there severe cold curtailed new construction.Blaming weather is a common tactic to salvage a forecast gone bad. So the question at hand must be why do we blame weather; what is the evidence? First, as noted above, cold weather affected starts in the regions where weather is coldest (NE and MW). Second, we can point to the obvious indicator of bad weather that the surge in utilities output tipped off in the industrial production report. That result also names weather as a nationally important event.Apart from that, February and March do not emerge as poster perfect months for seasonable weather. Some of the worst of winter’s weather has been back-loaded in 2006/07. This implies that housing may have much more rebound yet to show us. U.S. housing starts rose 9.0% in February, as they regained ground lost after a 14.3% decline in January, the Commerce Department reported Tuesday. Housing starts are off 28.5% year-over-year in February. Yet some regions show gains… Increases are concentrated in the South (+18.0%) and West (+26.4%) where milder weather helped recovery from similar declines in the prior month. The regions we expect to be more afflicted by bad weather show exactly that: the Northeast (-29.7%) and Midwest (-14.4%); there severe cold curtailed new construction.Blaming weather is a common tactic to salvage a forecast gone bad. So the question at hand must be why do we blame weather; what is the evidence? First, as noted above, cold weather affected starts in the regions where weather is coldest (NE and MW). Second, we can point to the obvious indicator of bad weather that the surge in utilities output tipped off in the industrial production report. That result also names weather as a nationally important event.Apart from that, February and March do not emerge as poster perfect months for seasonable weather. Some of the worst of winter’s weather has been back-loaded in 2006/07. This implies that housing may have much more rebound yet to show us.The overall chart on housing starts only hints at some sort of slowing in the process of housing’s decline (see chart above). But regional data show more clearly that a bottoming process is really in train (see table below). The annualized growth rates show that for the South and the West near term trends have turned up or gone flat compared to earlier trends that show declines still in play. Even over six months the West and South show little tendency to decline or only a small erosion. These are sharp contrasts to the data drawn from the ‘bad weather regions’ of the Northeast and Midwest. The Midwest shows accelerating weakness - a result I am not really prepared to take at face value even though there is clear potential cause; in the industrial sector that is the core of jobs in that region is really being battered. The Northeast also shows accelerating declines but a milder deceleration is at work there than the Midwest.On balance, as mixed as the regional data are, they display differences that are understandable and logically offer weather up as the explanation. This is another reminder to be careful in taking other data from the period as representative. If weather has had this sort of impact on housing and could distort industrial production, too, its impact on exaggerating weakness might be even more pronounced in reports where attribution of weakness to weather is not so obvious. |
| Feb 2007 | % Change at Ann Rate | ||
| Regional Trends | 3-Mo | 6-Mo | 1-Yr |
| Northeast | -47.1% | -31.3% | -27.4% |
| Midwest | -116.3% | -73.7% | -50.6% |
| South | -0.5% | -4.5% | -20.3% |
| West | 50.4% | 2.0% | -30.9% |
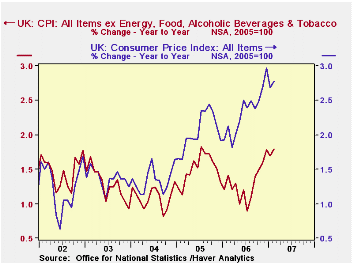
Inflation, as measured by the year over year increase in the Consumer Price Index (CPI) was 2.78%, nine basis point over January, but still below December's high of 2.97%. This is the measure that the Bank of England focuses on in assessing its monetary policy. February marked the eleventh month that inflation exceeded the Bank of England's target of 2%. During that time, the Bank of England raised its key interest rate from 4.5% to 5.25%.
While the CPI measure of inflation is the target, other aspects of inflation come into play. Core inflation, defined as the Total CPI, less Energy, Food and Alcoholic Beverages, shows a more benign picture. This measure of inflation also rose nine basis points but remains well below the 2% level as can be seen in the first chart. The widening difference between the two series was largely due to rising prices of energy. It is only recently that the substantial fall in energy prices that has taken place over the past year is beginning to work its way into the consumers' energy bill.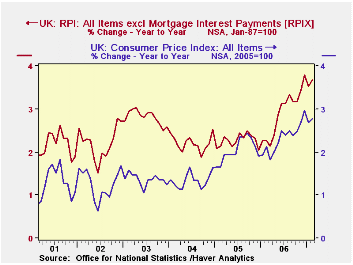
A less sanguine outlook for inflation appears when one looks at the Retail Price Index (RPI). This measure of inflation was 4.58% in February , compared with 4.24% in January and 4.43% in December and was the highest inflation rate since August of 1991. The RPI, includes mortgage interest and council tax payments that are not included in the CPI. The RPIX excludes these items, but it still shows a higher rate of inflation than the CPI measure, as can be seen in the second chart. The difference is due to a combination of factors, including differences in coverage of goods and services, difference in the weights used and the formulas. In February, the rate of inflation in the RPIX was 3.68%, above January's 3.54%, but below December's 3.79%.
The RPIX was the official measure of inflation until December, 2003 when the Bank adopted the CPI and it is still used in wage negotiations and in the cost of living adjustments for government pension.
| INFLATION IN THE UNITED KINGDOM | Feb 07 | Jan 07 | Dec 06 | 2006 | 2005 | 2004 |
|---|---|---|---|---|---|---|
| Consumer Price Index (CPI) Y/Y % | 2.78 | 2.69 | 2.97 | 2.33 | 2.05 | 1.34 |
| Core CPI Index Y/Y % | 1.79 | 1.70 | 1.78 | 1.30 | 1.51 | 1.09 |
| Retail Price Index (RIP) Y/Y % | 4.58 | 4.24 | 4.43 | 3.19 | 2.83 | 2.96 |
| Core Retail Price Index (RPIX) Y/Y % | 3.68 | 3.54 | 3.79 | 2.93 | 2.27 | 2.21 |

Robert Brusca
AuthorMore in Author Profile »Robert A. Brusca is Chief Economist of Fact and Opinion Economics, a consulting firm he founded in Manhattan. He has been an economist on Wall Street for over 25 years. He has visited central banking and large institutional clients in over 30 countries in his career as an economist. Mr. Brusca was a Divisional Research Chief at the Federal Reserve Bank of NY (Chief of the International Financial markets Division), a Fed Watcher at Irving Trust and Chief Economist at Nikko Securities International. He is widely quoted and appears in various media. Mr. Brusca holds an MA and Ph.D. in economics from Michigan State University and a BA in Economics from the University of Michigan. His research pursues his strong interests in non aligned policy economics as well as international economics. FAO Economics’ research targets investors to assist them in making better investment decisions in stocks, bonds and in a variety of international assets. The company does not manage money and has no conflicts in giving economic advice.
More Economy in Brief


