 Global| Feb 18 2009
U.S. Housing Starts Plumb AnotherRecord Low
by:Tom Moeller
|in:Economy in Brief
Summary
It now is more than clear that the pace of the downturn in the U.S. housing market has accelerated. The latest Commerce Department figures indicate that in January starts fell to 466,000 (AR), another record low in the series' history [...]
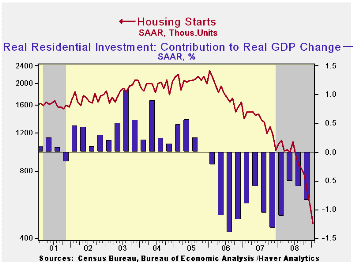
It now is more than clear that the pace of the downturn in the U.S. housing market has accelerated. The latest Commerce Department figures indicate that in January starts fell to 466,000 (AR), another record low in the series' history that extends back to 1959. December starts were revised slightly lower and the January level was well below Consensus expectations for 530,000 starts.
As with the release of the December figures, the January numbers indicate that the rate of decline in starts definitely has accelerated. At an annual rate, starts in January were eighty-six percent below the level of three months earlier. That surpassed the rate of decline during the "credit crunch" recession of 1980 and it's nearly one-third faster than the quickest in 2008.
Starts of single-family homes fell to another record low of
347,000 from a downwardly revised December level. The latest level is
down eighty-one percent since the peak in early 2006, about equal to the
annual rate of decline during the last three months. Permits
to build single-family homes also fell to another record low, off by
nearly one-third during the last three months. During the
last ten years there has been an 84% correlation between the q/q change
in single-family starts and their contribution to quarterly GDP growth.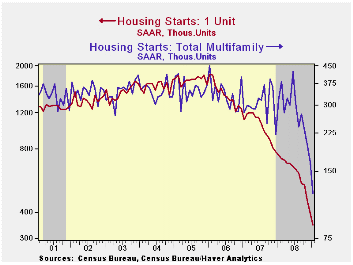
Starts of multi-family homes fell 27.9% in January and the latest level matched their record low in early-1993. They are down by nearly one-half during the last three months.
By region, in January starts of single-family units in the Northeast fell by more than half from the December level and were off by three-quarters from one year ago. Starts in the Midwest fell 20.3% from December and they were also down by more than one-half from January of 2008. In the South starts fell by a lesser 5.4% during January but they too were off by more than one-half from their January 2008 level. In the West starts eked out a 2.5% rise last month but they were off by more than one-third from the year ago level.
The housing starts figures can be found in Haver's USECON database.
Facts and Myths about the Financial Crisis of 2008 from Federal Reserve Bank of Minneapolis is available here.
Looking Behind the Aggregates: A Reply to “Facts and Myths about the Financial Crisis of 2008” from the Federal Reserve Bank of Boston can be found here.
| Housing Starts (000s, SAAR) | January | December | November | Y/Y | 2008 | 2007 | 2006 |
|---|---|---|---|---|---|---|---|
| Total | 466 | 560 | 655 | -56.2% | 902 | 1,341 | 1,812 |
| Single-Family | 347 | 395 | 456 | -53.7 | 618 | 1,034 | 1,474 |
| Multi-Family | 119 | 165 | 199 | -62.1 | 285 | 307 | 338 |
| Building Permits | 521 | 547 | 615 | -50.5 | 880 | 1,389 | 1,844 |
CBI Finds Further Weakening
by Robert Brusca February 18, 2009
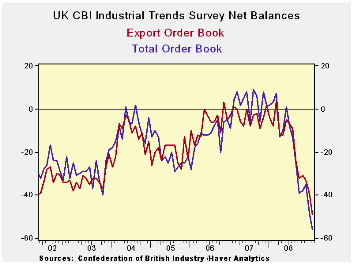
The UK MFG sector weakened further in February. The total
orders index is at its lowest since 2000 as is the export order
reading. Stocks of finished goods have never had a higher reading.
Looking ahead the expected outlook over the next three months is lowest
in this period. Average price expectations are in the bottom 36% of
their historic range.
The UK MFG sector continues to be very weak. The pace of the
deterioration is slightly less than last month’s 13 point drop at -8.
But that is still a rapid month to month deceleration. There is little
in the February survey to suggest that the weakness is playing out.
| UK Industrial volume data CBI Survey | ||||||||||
|---|---|---|---|---|---|---|---|---|---|---|
| Reported: | Feb 09 |
Jan 09 |
Dec 08 |
Nov 08 |
Oct 08 |
12 MO Avg |
Pcntle | Max | Min | Range |
| Total Orders | -56 | -48 | -35 | -38 | -39 | -16 | 0% | 9 | -48 | 57 |
| Export Orders | -49 | -39 | -33 | -31 | -32 | -16 | 0% | 3 | -39 | 42 |
| Stocks:FinGds | 27 | 27 | 21 | 25 | 24 | 16 | 100% | 27 | -2 | 29 |
| Looking ahead | ||||||||||
| Output Volume:Nxt 3M | -44 | -43 | -42 | -42 | -31 | -11 | 0% | 28 | -43 | 71 |
| Avg Prices 4Nxt 3m | -12 | 0 | 0 | 10 | 23 | 21 | 36% | 34 | -19 | 53 |
| From end 2000 | ||||||||||
| Compare to NTC MFG | ||||||||||
| Jan 09 |
Dec 08 |
Nov 08 |
Oct-08 | 12 MO Avg |
Pcntle | Max | Min | Range | ||
| UK MFG | 35.78 | 34.91 | 34.48 | 40.67 | 43.65 | 6% | 56.28 | 34.48 | 22 | |
U.S. Import Price Decline Quickened
by Tom Moeller February 18, 2009
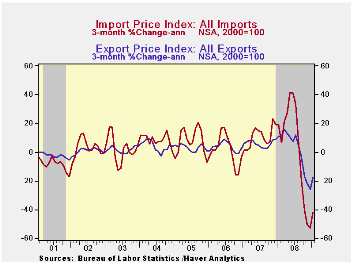
The worldwide recession continued to dampen pricing power last month. Overall U.S. import prices fell another 1.1% during January after a 5.0% December decline that was deeper than reported initially. The latest drop about matched Consensus expectations.
During the last twelve months, the 12.5% decline in import
prices is the quickest in the series' history which dates back to 1983.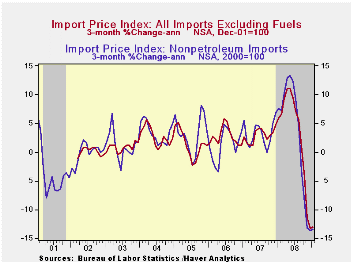
Petroleum prices fell 2.4% last month. That was a much slower rate of decline than during earlier months, but here in February the decline has quickened again. Crude oil prices are more than ten percent below the January average cost of $41.74 per barrel of crude. That is just back in the range of ten-to-thirty percent monthly declines in place since August.
January import prices less petroleum were down for the sixth straight month, by 0.8%. At an annual rate, the 13.4% decline over the last three months is near the record.
Through early February, the foreign exchange value of the dollar rose 12.6% versus the year-ago level and thus reduced the pressure on U.S. import prices. During the last ten years, there has been an 83% (negative) correlation between the nominal trade-weighted exchange value of the US dollar vs. major currencies and the y/y change in non oil import prices.
Capital goods import prices were unchanged last month following two consecutive months of decline. That's a reversal from earlier this year. On a three-month basis, prices fell at a 2.5% annual rate after 5%-to-6% rates of increase during early 2008. Less the lower prices of computers, capital goods prices in January rose 0.5%. The three-month growth rate fell to 0.4 after 9.0% growth earlier this year. Prices of computers, peripherals & accessories were down at an 8.7% rate during the last three months.
Prices for nonauto consumer goods were unchanged in January for the second consecutive month. The three-month rate of change remained a negative 1.9% versus the 5.9% peak rate of growth in early-2008. Durable goods prices overall fell at a 5.4% annual rate during the last three months, a reversal from the 6.2% rate of increase in early 2008. To the upside, apparel prices rose 0.3% during January and a 2.0% rate of growth during the last three months is stable with the 1.9% increase in prices during all of last year. Motor vehicle & parts prices fell at a 1.5% rate during the last three months after a 2.6% increase last year.
In yet another area, prices have weakened. Imported food prices fell at a 9.0% annual rate during the last three months after an 11.8% jump during 2008. That increase followed an 8.2% 2007 surge and a 4.0% 2006 increase.
Total export prices increased 0.5% during January after five months of sharp decline. Nonagricultural export prices were unchanged (-2.9% year-to-year) but agricultural prices recovered all of their December drop with a 6.2% (-9.7% y/y) increase.
The import and export price series can be found in Haver's USECON database. Detailed figures are available in the USINT database.
Overview: Global Financial Crisis Spurs Unprecedented Action from the BIS Quarterly Review is available here.
| Import/Export Prices (NSA, %) | January | December | Y/Y | 2008 | 2007 | 2006 |
|---|---|---|---|---|---|---|
| Import - All Commodities | -1.1 | -5.0 | -12.5 | 11.5 | 4.2 | 4.9 |
| Petroleum | -2.4 | -27.2 | -55.0 | 37.7 | 11.6 | 20.6 |
| Nonpetroleum | -0.8 | -1.1 | -0.6 | 5.3 | 2.7 | 1.7 |
| Export- All Commodities | 0.5 | -2.2 | -3.6 | 6.0 | 4.9 | 3.6 |
U.S. Factory Output Down Sharply Again in January; Off 10.0% Y/Y
by Tom Moeller February 18, 2009
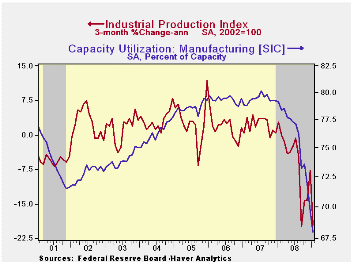
The U.S. factory sector remained severely depressed last month. Industrial production during January fell 1.8% after the 2.4% drop during December which was revised deeper from the initial report. Last month's decline about matched Consensus expectations for a 1.5% decline.
Year-to-year output is off 10.0%, the sharpest decline since early 1975. Reduced domestic demand, inventory cutbacks and recessions abroad have combined to lower overall U.S. production like it never has. And downward momentum has gained steam.
An acceleration in that downward momentum is apparent in the 19.7% annual rate of output decline during the last three months. But that understates the severity of the shortfall because mining and utility output is up. In the factory sector alone, output is off at a 26.7% annual rate during the last three months versus a modest 2.6% drop during all of last year.
Output of construction supplies has fared the worst. A 3.4%
drop in production last month lowered the three-month rate of decline
to 37.3% following the 6.2% drop during all of last year. Output of
consumer goods fell 1.8% last month and the three-month rate of change
accelerated to -17.2%. That was accentuated by a 77.5% three-month
annual rate of decline in the output of motor vehicles & parts.
That came on top of a 14.5% decline during all of last year. Outside of
the auto sector, output also was hard hit. Production of furniture fell
at a 28.0% during the last three months while apparel output fell at a
29.2% rate. Production of business equipment resumed its downward trend
last month with a 3.7% decline which reversed two months of increase.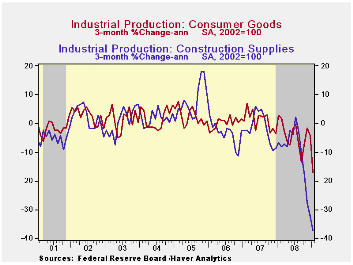
Industrial production in the high-tech sector fell 3.2% last month capping a 12.8% year-to-year decline. Less that downdraft in high tech, overall industrial production fell 2.6% last month and the annual rate of change of -13.7% was the weakest since 1975.
Outside of output declines in autos and high tech, total production which includes mining and utilities fell 0.9% last month and the three-month annual rate of decline accelerated to -13.9%. The rate of decline in factory sector output less these two sectors accelerated to -20.7%.
Excess capacity continued to grow last month. Capacity utilization fell to 72.0%, the lowest level since 2003. Utilization in the factory sector dropped even harder to 68.0% from a peak near 80% back in 2007. Capacity in the factory sector increased a somewhat reduced 1.4% (y/y).
The industrial production data are available in Haver's USECON database.
The Credit Crunch of 2007-2008: A Discussion of the Background, Market Reactions and Policy Responses from the Federal Reserve Bank of St. Louis can be found here.
| INDUSTRIAL PRODUCTION (SA, %) | January | December | Y/Y | 2008 | 2007 | 2006 |
|---|---|---|---|---|---|---|
| Total Output | -1.8 | -2.4 | -10.0 | -1.8 | 1.7 | 2.2 |
| Manufacturing | -2.6 | -2.9 | -12.8 | -2.5 | 1.7 | 2.4 |
| Consumer Goods | -1.8 | -2.0 | -7.9 | -2.2 | 1.7 | 0.3 |
| Business Equipment | -3.7 | 2.4 | -10.9 | -1.3 | 3.3 | 10.4 |
| Construction Supplies | -3.4 | -4.1 | -16.7 | -6.2 | -2.5 | 2.2 |
| Utilities | 2.7 | -0.2 | 1.4 | 0.5 | 3.3 | -0.6 |
| Capacity Utilization | 72.0 | 73.3 | 81.0 (Jan.'08) | 78.2 | 81.0 | 80.9 |

Tom Moeller
AuthorMore in Author Profile »Prior to joining Haver Analytics in 2000, Mr. Moeller worked as the Economist at Chancellor Capital Management from 1985 to 1999. There, he developed comprehensive economic forecasts and interpreted economic data for equity and fixed income portfolio managers. Also at Chancellor, Mr. Moeller worked as an equity analyst and was responsible for researching and rating companies in the economically sensitive automobile and housing industries for investment in Chancellor’s equity portfolio. Prior to joining Chancellor, Mr. Moeller was an Economist at Citibank from 1979 to 1984. He also analyzed pricing behavior in the metals industry for the Council on Wage and Price Stability in Washington, D.C. In 1999, Mr. Moeller received the award for most accurate forecast from the Forecasters' Club of New York. From 1990 to 1992 he was President of the New York Association for Business Economists. Mr. Moeller earned an M.B.A. in Finance from Fordham University, where he graduated in 1987. He holds a Bachelor of Arts in Economics from George Washington University.
More Economy in Brief


