 Global| Oct 17 2008
U.S. Housing Starts Fell Further in September
by:Tom Moeller
|in:Economy in Brief
Summary
Housing starts fell 6.3% m/m last month to 817,000 units (SAAR). That followed an 8.1% decline during August which was deeper than reported initially. The latest level was the lowest since 921,000 starts during January 1991. Consensus [...]
Housing starts fell 6.3% m/m last month to 817,000 units (SAAR). That followed an 8.1% decline during August which was deeper than reported initially. The latest level was the lowest since 921,000 starts during January 1991. Consensus expectations had been for 874,000 starts.
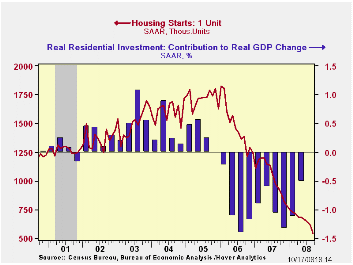
During September, starts of single-family homes fell by 12.0%
to 544,000 units, their lowest level since late-1981. Since their peak
in early 2006, single-family starts are down by roughly two-thirds.
Permits to build these single family homes also fell 3.8% (-38.9% y/y)
to 532,000, their lowest since the recession during 1982.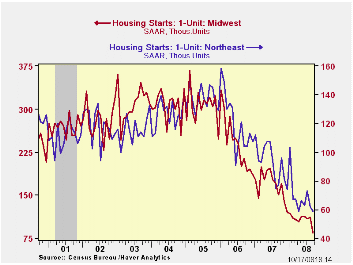
Starts during 2Q fell by 7.2% from 1Q and that decline was accompanied by a 0.5 percentage point subtraction from real GDP growth. In 3Q, single-family starts fell 10.9% from the 2Q average. These new figures suggest that housing this quarter will even more of drag on GDP. During the last ten years there has been an 84% correlation between the q/q change in single-family starts and the contribution to quarterly GDP growth.
Multi-family starts in September recouped just a bit of their earlier declines with a 7.5% increase. Nonetheless, 3Q starts fell 20.7% from 2Q after that period's 7.5%.
By region, August starts of single-family units in the Northeast fell 4.8% (-23.4% y/y) to a new low. In the Midwest starts fell an even harder 24.1% (-43.3% y/y). In the South single family starts fell 6.3% (-42.3% y/y) while in the West starts dropped 17.7% (-45.5% y/y) and erased all of the prior months' gains.
Housing Busts and Household Mobility from the Federal Reserve Bank of New York can be found here.
| Housing Starts (000s, SAAR) | September | August | July | Y/Y | 2007 | 2006 | 2005 |
|---|---|---|---|---|---|---|---|
| Total | 817 | 872 | 949 | -31.1% | 1,341 | 1,812 | 2,073 |
| Single-Family | 544 | 618 | 644 | -41.9 | 1,034 | 1,474 | 1,719 |
| Multi-Family | 273 | 254 | 305 | 9.6 | 307 | 338 | 354 |
| Building Permits | 786 | 857 | 937 | -38.4 | 1,389 | 1,844 | 2,160 |
by Tom Moeller October 17, 2008
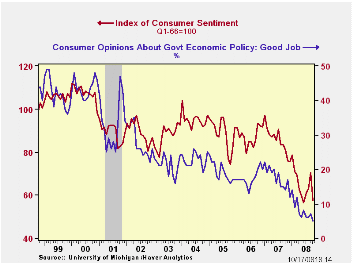
We got our first glimpse of consumer's reaction to the unfolding crises in the credit markets. The University of Michigan's mid-October reading of consumer sentiment collapsed by 18.2% from the September level, to 57.5. The latest level was the lowest for the series since June which in turn was the lowest since early 1980. The drop was a record m/m decline for the index which dates back to the late 1970s. Consensus had expected a lesser decline to 65.0.
During the last ten years there has been a 47% correlation between the level of sentiment and the three-month change in real consumer spending.
The current conditions index led the collapse with 21.5% decline. The view of current personal finances gave back all of a September improvement and fell 26.7% while index of buying conditions for large household goods fell 17.8% m/m, down 38.0% y/y.
The expectations component of consumer sentiment aided the m/m
decline in the total with a 15.6% drop. Expectations for business
conditions during the next year collapsed by 26.2%. Expectations for
conditions during the next five years fell 13.3%.The expected change in
personal finances also fell 12.5%.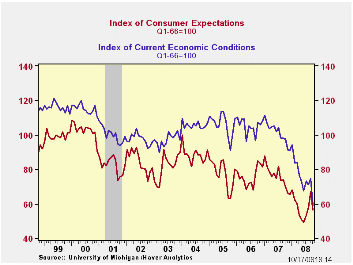
The mean expected rate of inflation during the next year held steady at 4.6% with lower oil prices. It was as high as 7.0% in May. The expected inflation rate during the next five years fell to 2.9%, the lowest level since 2003.
The opinion of government policy, which apparently influences economic expectations, fell sharply from September (-41.5% y/y). Only five percent of respondents thought that a good job was being done by government, the least since 5%.
The University of Michigan survey is not seasonally adjusted.The reading is based on telephone interviews with about 500 households at month-end; the mid-month results are based on about 300 interviews. The summary indexes are in Haver's USECON database, with details in the proprietary UMSCA database.
| University of Michigan | Mid-October | September | October y/y | 2007 | 2006 | 2005 |
|---|---|---|---|---|---|---|
| Consumer Sentiment | 57.5 | 70.3 | -28.9% | 85.6 | 87.3 | 88.5 |
| Current Conditions | 58.9 | 75.0 | -39.7 | 101.2 | 105.1 | 105.9 |
| Expectations | 56.7 | 67.2 | -19.1 | 75.6 | 75.9 | 77.4 |
by Robert Brusca October 17, 2008
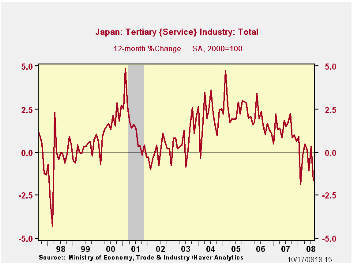
The tertiary index fell in August after two months of stability. The Yr/Yr percentage change in the index is hovering in negative territory and has just taken a weaker position with this report.
The index is still in the top 10% of its range but then the service index usually does rise. Setbacks to it are uncommon. The weakness in the tertiary index is another red flag for the slowing in the Japanese economy.
The declines in the tertiary index in this period already rival the drops in the previous recession period from 2000-2003.
| Up to date Japan Industry Survey | |||||||||
|---|---|---|---|---|---|---|---|---|---|
| Recent Months | Moving Averages | Extremes; Range | |||||||
| Aug-2008 | Jul-2008 | Jun-2008 | 3-Mo | 6-Mo | 12-Mo | Max | Min | %-Tile | |
| Tertiary | 109.1 | 110.6 | 109.3 | 109.7 | 109.8 | 109.9 | 110.9 | 92.0 | 90.5% |
| Ranges, Max, Min since 1993 | |||||||||
by Robert Brusca October 17, 2008
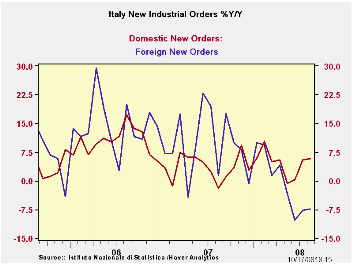
Italian orders have fallen in August after several months of gains. Foreign orders are much weaker than domestic orders in Italy. Foreign orders have dropped in six of the past seven months. Domestic orders are down in just two of those seven months. Still, over that period, starting in February of 2008 overall orders are lower. The international sector is dragging Italy’s industrial sector into decline. Over this period industrial sales have fallen by 4%, not even annualized.
| Italy Orders | ||||||
|---|---|---|---|---|---|---|
| Saar exept m/m | Aug-08 | Jul-08 | Jun08 | 3-mo | 6-mo | 12-mo |
| Total | -0.3% | 2.7% | 0.7% | 13.2% | -1.4% | 1.1% |
| Foreign | -3.4% | -0.7% | 1.2% | -11.3% | -14.3% | -7.4% |
| Domestic | 1.2% | 4.6% | 0.5% | 28.2% | 5.9% | 5.9% |
| Memo | ||||||
| Sales | -3.0% | -2.7% | 3.1% | -10.4% | -7.9% | -7.1% |

Tom Moeller
AuthorMore in Author Profile »Prior to joining Haver Analytics in 2000, Mr. Moeller worked as the Economist at Chancellor Capital Management from 1985 to 1999. There, he developed comprehensive economic forecasts and interpreted economic data for equity and fixed income portfolio managers. Also at Chancellor, Mr. Moeller worked as an equity analyst and was responsible for researching and rating companies in the economically sensitive automobile and housing industries for investment in Chancellor’s equity portfolio. Prior to joining Chancellor, Mr. Moeller was an Economist at Citibank from 1979 to 1984. He also analyzed pricing behavior in the metals industry for the Council on Wage and Price Stability in Washington, D.C. In 1999, Mr. Moeller received the award for most accurate forecast from the Forecasters' Club of New York. From 1990 to 1992 he was President of the New York Association for Business Economists. Mr. Moeller earned an M.B.A. in Finance from Fordham University, where he graduated in 1987. He holds a Bachelor of Arts in Economics from George Washington University.
More Economy in Brief


