 Global| Nov 18 2009
U.S. Housing Starts Fall To Their Lowest Level Since April
by:Tom Moeller
|in:Economy in Brief
Summary
Housing sector activity continued to moderate after increases this past spring. Housing starts fell last month to 529,000 (AR) units versus 592,000 during September which was revised up slightly. The latest level was the lowest since [...]
 Housing
sector activity continued to moderate after increases this past spring.
Housing starts fell last month to 529,000 (AR) units versus 592,000
during September which was revised up slightly. The latest level was
the lowest since April and down nearly one-third y/y. More sobering was
that since the peak in January of 2006 starts have fallen by more than
three-quarters. In addition, October's figure fell well short of
Consensus expectations for 600,000 starts.
Housing
sector activity continued to moderate after increases this past spring.
Housing starts fell last month to 529,000 (AR) units versus 592,000
during September which was revised up slightly. The latest level was
the lowest since April and down nearly one-third y/y. More sobering was
that since the peak in January of 2006 starts have fallen by more than
three-quarters. In addition, October's figure fell well short of
Consensus expectations for 600,000 starts.
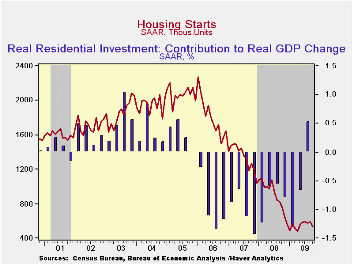
Loss of forward momentum was evident in the decline in starts of single-family homes. They fell 3.9% last month to 476,000 units (AR), reversed all of the prior month's increase and were at the lowest level since May. Despite these disappointments, however, single-family starts were one-third higher than the February low. During the last ten years, there has been an 84% correlation between the q/q change in single-family starts and their contribution to quarterly GDP growth.
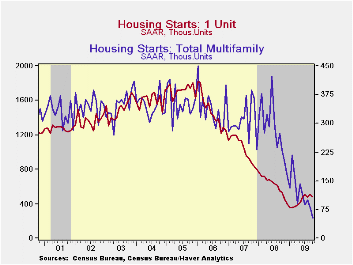 A further
loss of momentum was evident in the multi-family sector where
starts starts fell by one-third m/m during October to the record low.
Starts of apartments, condominiums & town houses were down
88.2% from the January 2006 peak.
A further
loss of momentum was evident in the multi-family sector where
starts starts fell by one-third m/m during October to the record low.
Starts of apartments, condominiums & town houses were down
88.2% from the January 2006 peak.
Starts of single-family units fell throughout the country last month. Single-family starts in the Northeast fell 9.6% (-17.5% y/y) while starts in the South fell 7.3% (-4.9% y/y). In the Midwest starts declined 4.8% (-16.8% y/y) and starts in the West fell 5.9% (-16.5% y/y) to their lowest level since May.
Building permits dropped 4.0%, the third decline in four months, but remained 10.8% above their record low reached in April. As with starts, permits to build a single-family home have been relatively strong. They fell just 0.2% last month and were down 4.0% y/y.
The housing starts figures can be found in Haver's USECON database.
How Rigid Are Producer Prices? from the Federal Reserve Bank of New York can be found here.
| Housing Starts (000s, SAAR) | October | Oct. Y/Y | September | August | 2008 | 2007 | 2006 |
|---|---|---|---|---|---|---|---|
| Total | 529 | -30.7% | 592 | 581 | 900 | 1,342 | 1,812 |
| Single-Family | 476 | -10.9 | 511 | 481 | 616 | 1,036 | 1,474 |
| Multi-Family | 53 | -76.9 | 81 | 100 | 285 | 306 | 338 |
| Building Permits | 552 | -24.3 | 575 | 580 | 895 | 1,392 | 1,844 |

Tom Moeller
AuthorMore in Author Profile »Prior to joining Haver Analytics in 2000, Mr. Moeller worked as the Economist at Chancellor Capital Management from 1985 to 1999. There, he developed comprehensive economic forecasts and interpreted economic data for equity and fixed income portfolio managers. Also at Chancellor, Mr. Moeller worked as an equity analyst and was responsible for researching and rating companies in the economically sensitive automobile and housing industries for investment in Chancellor’s equity portfolio. Prior to joining Chancellor, Mr. Moeller was an Economist at Citibank from 1979 to 1984. He also analyzed pricing behavior in the metals industry for the Council on Wage and Price Stability in Washington, D.C. In 1999, Mr. Moeller received the award for most accurate forecast from the Forecasters' Club of New York. From 1990 to 1992 he was President of the New York Association for Business Economists. Mr. Moeller earned an M.B.A. in Finance from Fordham University, where he graduated in 1987. He holds a Bachelor of Arts in Economics from George Washington University.
More Economy in Brief


