 Global| Jul 20 2010
U.S. Housing Starts Fall Again After Tax Incentive Expires
by:Tom Moeller
|in:Economy in Brief
Summary
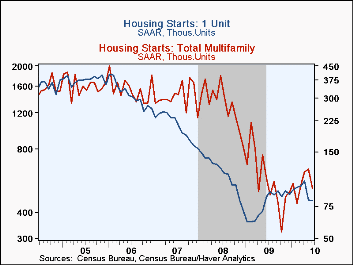
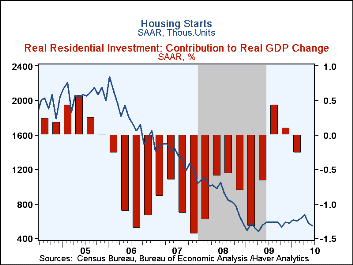
Again, with the elimination of the government's program to stimulate housing, the sector's activity fell. June housing starts dropped another 5.0% m/m to 549,000 (AR) after a 14.9% May drop that was deeper than reported initially. The [...]
 Again, with the elimination of the government's program to stimulate housing,
the sector's activity fell. June housing starts dropped another 5.0% m/m to 549,000
(AR) after a 14.9% May drop that was deeper than reported initially. The latest
was the lowest since October and the May level was revised down from 593,000.
June also was lower than Consensus expectations for 579,000 starts.
Starts of single-family homes slipped just 0.7% from May to 454,000, the lowest level since May of last year. In the Midwest starts fell 11.3% (-18.4% y/y) while in the Northeast they fell 8.9% (+8.5% y/y). Working the other way, single-family starts in the South rose 3.6% (-2.1% y/y) while in the West they rose 3.1% (-4.8% y/y).Activity in the the multi-family sector weakened after two months of improvement. Starts of apartments, condominiums & town houses fell by nearly one-quarter m/m to 95,000.
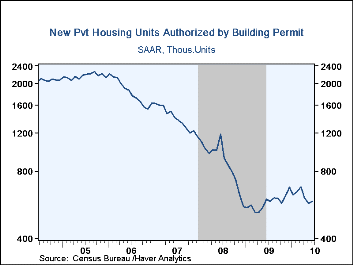
A glimmer of good news in the report was that building permits during June rose 2.1% following two months of sharp decline. The increase was, however, due to higher permits to build multi-family homes which increased 19.6% from May (10.7% y/y) to the highest level since February of last year. Single-family permits fell 3.4% (-6.7% y/y) for the third consecutive month of decline.
The housing starts figures can be found in Haver's USECON database.
Recovering from the Housing and Financial Crisis is from the Federal Reserve Bank of Dallas and it can be found here.
Tom Moeller
AuthorMore in Author Profile »Prior to joining Haver Analytics in 2000, Mr. Moeller worked as the Economist at Chancellor Capital Management from 1985 to 1999. There, he developed comprehensive economic forecasts and interpreted economic data for equity and fixed income portfolio managers. Also at Chancellor, Mr. Moeller worked as an equity analyst and was responsible for researching and rating companies in the economically sensitive automobile and housing industries for investment in Chancellor’s equity portfolio. Prior to joining Chancellor, Mr. Moeller was an Economist at Citibank from 1979 to 1984. He also analyzed pricing behavior in the metals industry for the Council on Wage and Price Stability in Washington, D.C. In 1999, Mr. Moeller received the award for most accurate forecast from the Forecasters' Club of New York. From 1990 to 1992 he was President of the New York Association for Business Economists. Mr. Moeller earned an M.B.A. in Finance from Fordham University, where he graduated in 1987. He holds a Bachelor of Arts in Economics from George Washington University.


