 Global| May 19 2015
U.S. Housing Starts and Permits Jump to 2007 Highs
by:Tom Moeller
|in:Economy in Brief
Summary
New home construction is emerging from its winter doldrums. Housing starts during April increased 20.2% to a 1.135 million annual rate (9.2% y/y), the highest point since November 2007. The gain followed an upwardly revised rise to [...]
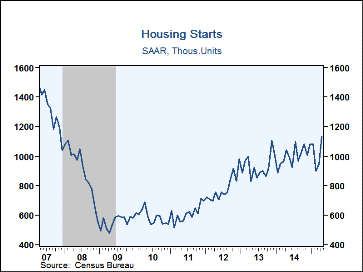
New home construction is emerging from its winter doldrums. Housing starts during April increased 20.2% to a 1.135 million annual rate (9.2% y/y), the highest point since November 2007. The gain followed an upwardly revised rise to 944,000 units, last month reported as 926,000. Last month's improvement surpassed expectations for 1.020 million starts in the Action Economics Forecast Survey.
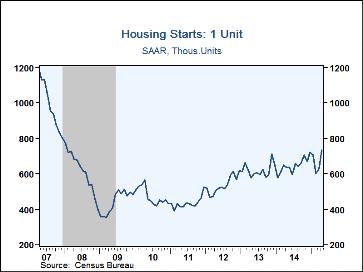
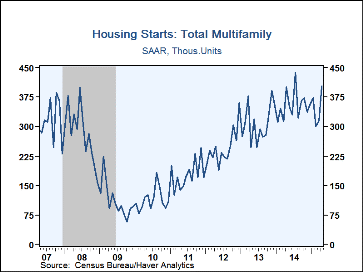
Single-family starts rose 16.7% to 733,000 (13.8% y/y) following a 4.7% increase. Starts to build multi-family homes rose 27.2% to 402,000 (0.9% y/y) after a 5.3% March gain.
Starts rose m/m throughout most of the country. Activity in the Northeast surged 85.9% to 184,000 (50.0% y/y). Severe winter weather dropped them to 25% of February's level. New building rose 39.0% to 278,000 in the West (15.6% y/y). Starts in the Midwest gained 27.8% to 170,000 but they remained down 7.4% y/y. In the South, new building eased 1.8% to 503,000 (+2.5% y/y).
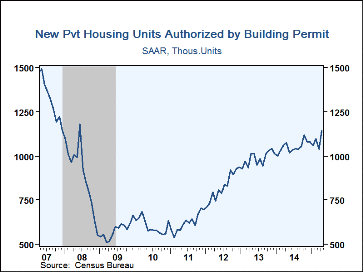
Permits to build housing units increased 10.1% to 1.143 million units (6.0% y/y) following declines in four of the previous five months. The latest level was the highest since December 2007. Single-family permits gained 3.7% (7.0% y/y) following a 2.8% rise. Multi-family permits rose 20.5% (4.3% y/y), rebounding after a 16.1% drop.
The housing starts figures can be found in Haver's USECON database. The expectations figure is contained in the AS1REPNA database.
The Puzzle of Weak First-Quarter GDP Growth from the Federal Reserve Bank of San Francisco can be found here.
| Housing Starts (000s, SAAR) | Apr | Mar | Feb | Apr Y/Y % | 2014 | 2013 | 2012 |
|---|---|---|---|---|---|---|---|
| Total | 1,135 | 944 | 900 | 9.2 | 1,001 | 928 | 784 |
| Single-Family | 733 | 628 | 600 | 13.8 | 647 | 620 | 537 |
| Multi-Family | 402 | 316 | 300 | 0.9 | 354 | 308 | 247 |
| Starts By Region | |||||||
| Northeast | 184 | 99 | 46 | 50.0 | 110 | 97 | 80 |
| Midwest | 170 | 133 | 102 | -7.4 | 160 | 149 | 129 |
| South | 503 | 512 | 509 | 2.5 | 496 | 467 | 400 |
| West | 278 | 200 | 243 | 15.6 | 236 | 217 | 175 |
| Building Permits | 1,143 | 1,038 | 1,098 | 6.0 | 1,052 | 987 | 829 |
Tom Moeller
AuthorMore in Author Profile »Prior to joining Haver Analytics in 2000, Mr. Moeller worked as the Economist at Chancellor Capital Management from 1985 to 1999. There, he developed comprehensive economic forecasts and interpreted economic data for equity and fixed income portfolio managers. Also at Chancellor, Mr. Moeller worked as an equity analyst and was responsible for researching and rating companies in the economically sensitive automobile and housing industries for investment in Chancellor’s equity portfolio. Prior to joining Chancellor, Mr. Moeller was an Economist at Citibank from 1979 to 1984. He also analyzed pricing behavior in the metals industry for the Council on Wage and Price Stability in Washington, D.C. In 1999, Mr. Moeller received the award for most accurate forecast from the Forecasters' Club of New York. From 1990 to 1992 he was President of the New York Association for Business Economists. Mr. Moeller earned an M.B.A. in Finance from Fordham University, where he graduated in 1987. He holds a Bachelor of Arts in Economics from George Washington University.


