 Global| Apr 24 2007
U.S. Housing Drops Sharply, But it’s a Distortion - Look to the Moving Average
Summary
Existing home sales fell sharply in March but only after a similar sharp ramping up over the previous two months. The moving average of sales tells a better story falling by only a modest amount in the month. Meanwhile, home prices [...]
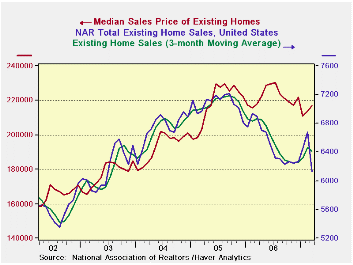
Existing home sales fell sharply in March but only after a similar sharp ramping up over the previous two months. The moving average of sales tells a better story falling by only a modest amount in the month. Meanwhile, home prices came back in the month (NSA) and are still lower year-over-year, but by a fractional 0.3%. Compared to its peak NSA price in July of 2006, median home prices are off by 5.7% and since housing prices make their peak in the summer, that is an exaggeration. Housing remains weak but is hardly falling apart despite his month’s number. Nationwide and in general the decline in home prices has not been large.
The table below shows sequential growth rates for sales by region. There is no clear pattern – but that is actually good news since this month’s drop was so severe and so distorting. Overall, the 3-month pace of sales decline is slightly lower than the year/year pace. But regions show all different results/patterns. House prices are weaker year/year for all regions except the South where a slight gain was posted in March.
By and large while housing has its pessimistic voices and optimistic voices, we are more inclined to see some silver lining in this month’s cloudy (rainy) report. The severity of the headline’s decline in sales is an exaggeration that blunts earlier good news. Price declines are NOT gathering pace. For the most part if the economy does stabilize, housing looks like it will be ok. And there is no trend in housing that makes it look as though it is going to drag economic growth lower. I think the days of those fears are gone. The stock of homes for sale is diminishing and that should reduce pressures too. While some say housing still has not shown the worst of it, we respectfully disagree.
| Mo/Mo% | Total | North-East | Mid-West | South | West |
| Mar.07 | -8.4% | -8.2% | -10.9% | -6.2% | -9.1% |
| Feb.07 | 3.7% | 15.1% | 2.6% | 1.2% | 0.0% |
| Jan.07 | 2.7% | -0.9% | 4.1% | 2.0% | 5.6% |
| Dec.06 | 0.3% | -0.9% | 2.8% | 0.8% | -2.3% |
| 3-Mo:ar | -9.6% | 18.7% | -19.2% | -12.9% | -16.0% |
| 6-mo:ar | -3.5% | 15.4% | -4.2% | -8.7% | -9.5% |
| 1-Year | -11.3% | -5.1% | -13.7% | -9.7% | -16.7% |
| Prices: | Median Prices | ||||
| One Mo: | 1.6% | 2.1% | 3.3% | 1.2% | -1.8% |
| One Year: | -0.3% | -0.7% | -0.2% | 0.4% | -2.9% |
by Robert Brusca April 24, 2007
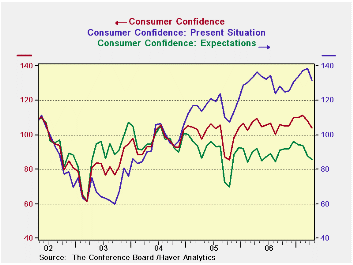
The story of consumer confidence is that the index is now just one month off its peak reading for this expansion cycle—not exactly the kind of thing to get worried about. The present situation sub-index is also one-month off its peak of the cycle. The expectations sub-index is sliding more persistently. That index reached its peak back in late 2003. Weakness in this series as the expansion grinds on is to be expected. Sharp drops in expectations are to be worried about. What we have here is a steady erosion in expectations.
The table below presents the various components of the present situation and expectations indexess showing them as DIFFUSION values. Present situation readings for businesses and for employment are solid with diffusion readings at 55.8 for business and 53.7 for employment. For expectations things get a bit more frayed. Business conditions are still expected to be positive as the diffusion reading for 6-months ahead is 51.7. The employment outlook, however, is a contractionary 48.6. Income expectations at 54.1 are still solid. However, in looking at the responses we find that the prevalent expectation is for NO CHANGE. Since late 2003 we have the greatest number of respondents saying ‘no change’ for business conditions that we have seen in this period. For employment and income expectations we are also looking at near record ‘no change’ readings for the period. Economic agents seem to be confused about what to expect.
Buying plans are weak. Although plans to buy a new car are still above what has been normal. Plans to buy a house are very low. I’m just guessing here but I’ll bet that plans to buy a new home with a sub-prime mortgage are even lower…
| Raw Indices | Apr-07 | Mar-07 | Feb-07 | Jan-07 | Dec-06 | Nov-06 | Oct-06 |
| Confidence Index | 104.0 | 108.2 | 111.2 | 110.2 | 110.0 | 105.3 | 105.1 |
| Present Situation: | 131.3 | 138.5 | 137.1 | 133.9 | 130.5 | 125.4 | 125.1 |
| Expectations | 85.8 | 87.9 | 93.8 | 94.4 | 96.3 | 91.9 | 91.9 |
| Present Situation Responses: Diffusion Indices | |||||||
| Business Conditions | 55.8 | 57.1 | 57.0 | 55.9 | 56.3 | 55.7 | 55.6 |
| Employment | 53.7 | 55.7 | 55.0 | 55.0 | 53.2 | 51.8 | 51.9 |
| Expectations(6-mo): Diffusion Indices | |||||||
| Business Conditions | 51.7 | 52.4 | 53.9 | 54.2 | 54.5 | 53.8 | 54.3 |
| Employment | 48.6 | 48.4 | 49.6 | 49.1 | 49.2 | 48.6 | 48.6 |
| Income | 54.1 | 55.0 | 55.5 | 56.2 | 57.1 | 56.5 | 55.8 |
| Buying Plans: Raw Responses and Weighted Indices | |||||||
| Automobile | Apr-07 | Mar-07 | Feb-07 | Jan-07 | Dec-06 | Nov-06 | Oct-06 |
| Yes: Auto | 6 | 5.4 | 5.5 | 6.3 | 5.4 | 5.2 | 6.2 |
| New: Auto | 3.2 | 2.7 | 2.4 | 3 | 2.6 | 2.3 | 2.9 |
| House | Apr-07 | Mar-07 | Feb-07 | Jan-07 | Dec-06 | Nov-06 | Oct-06 |
| Yes: House | 2.7 | 3.2 | 3.4 | 3.3 | 2.9 | 3.2 | 3.1 |
| New: House | 0.7 | 0.8 | 1.1 | 1.2 | 0.5 | 1.1 | 0.6 |
| Major Appliance | 30.3 | 32.7 | 32.1 | 29.6 | 27.8 | 29.8 | 28.5 |
by Louise Curley April 24, 2007
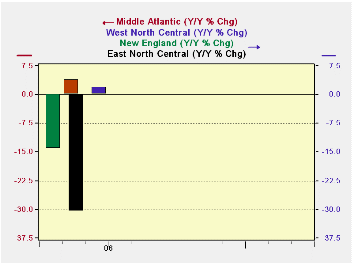
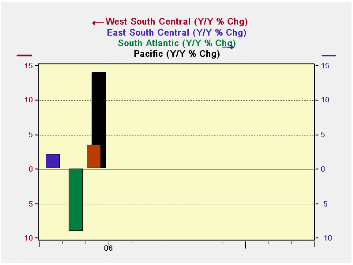
Current conditions are very erratic across the country. The charts below the spotty and irregular performance in Yr/Yr current conditions across regions. Only three are lower Yr/Yr but the E. North Central region is down hard and both the New England and South Atlantic regions are off significantly. On the upside the Pacific region is up strongly but most of the other regions are up only modestly.
Placed in the perspective of the recent economic recovery since late 2003, the NE Central is not just weak but on a new low for this part of the cycle while its current conditions reading stands only in its 12th percentile, the bottom 12% of all readings. Generally the regions out West are going better.
| · On balance, we find there is still exists a lot of uneven conditions around the nation. This month, consumer confidence and the present situation eroded in each major region month to month except for a sizeable increase in the present conditions index in the Pacific region. While the overall index of consumer confidence is not far off peak we must wonder if this sort of broad-based weakness is a new feeling of malaise or actual encroaching weakness or simply the result of pretty odd weather/calendar patterns. This is another of the indexes we will want to keep close tabs on (actually the whole family of consumer attitude indexes). There is no sense of there being any fluke in this survey since both the weekly ABC/Washington Post index and the monthly U of M index of consumer sentiment have been weakening. In this month’s report we also saw inflation expectations rise. · It was not an upbeat report for April. But then again, based on where the various indexes stand in historic context, it was not too bad either. It’s about the way things have been going. There is no evidence of a break out here in either direction. |
|---|
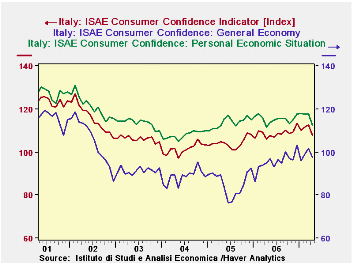
Italian consumers have turned sharply negative according to the April ISAE survey of consumer confidence*.The overall index declined 4.3% from March. Consumers' confidence in the general economic situation declined 4.0% and confidence in their personal situation declined 4.3%. Underlying the decline in confidence in their personal situation was a sharp decline in confidence regarding the future, which declined 6.3%. Confidence in their current personal situation was down only 1.2%. The first chart shows the ISAE consumer confidence indicator, the indicator for the general economic situation and the indicator for the household's personal situation.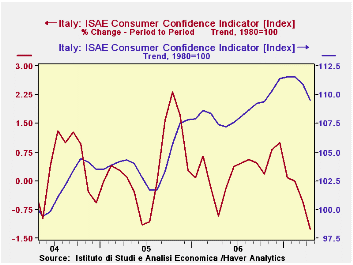
A part of the drop in confidence in April may be explained by the sluggish performance of the Italian economy in recent years. Although the economy grew slightly above expectations in 2006, it was still only 1.9%, compared with 2.1% in France and 2.89% in Germany. Industrial production has declined in January and February of this year. In addition, the government raised taxes on incomes above 40,000 euros ($54,000 at euro=1.35 dollars) earlier this year.
In a somewhat longer perspective the picture is not so bleak. In spite of the April decline, overall confidence was 1.6% above April, 2006 and the appraisal of the general economic condition was 2.8% above April, 2006. Consumers were 3.9% more confident of their personal current condition, but were 2.3% less confident about the future than in April, 2006. The upward trend in Italian Consumer confidence that began in mid 2004 has not been without its sharp ups and downs. The trend adjusted series has weathered monthly declines almost as large as the of April 2007, as can be seen in the second chart that shows the trend adjusted confidence indicator and its month to month changes.*The survey, conducted by the Institute for Studies and Economic Analysis in Rome, interviews some 2000 households. The April survey was carried out between April 1 and April 14.
| ITALIAN CONSUMER CONFIDENCE | Apr 07 | Mar 07 | Apr 06 | M/M % | Y/Y % | 2006 | 2005 | 2004 |
|---|---|---|---|---|---|---|---|---|
| ISAE Consumer Confidence Indicator (1980=100) | 107.8 | 112.6 | 106.1 | -4.26 | 1.60 | 108.7 | 104.2 | 101.5 |
| General Economic Situation | 97.6 | 101.7 | 94.9 | -4.03 | 2.85 | 95.6 | 85.4 | 88.6 |
| Personal Economic Situation | 112.5 | 117.5 | 111.4 | -4.26 | 0.99 | 115.3 | 113.7 | 107.9 |
| Current Situation | 114.0 | 115.4 | 109.7 | -1.21 | 3.92 | 112.2 | 106.8 | 102.1 |
| Future Situation | 100.6 | 107.4 | 102.9 | -6.33 | -2.29 | 104.4 | 101.1 | 100.8 |
Robert Brusca
AuthorMore in Author Profile »Robert A. Brusca is Chief Economist of Fact and Opinion Economics, a consulting firm he founded in Manhattan. He has been an economist on Wall Street for over 25 years. He has visited central banking and large institutional clients in over 30 countries in his career as an economist. Mr. Brusca was a Divisional Research Chief at the Federal Reserve Bank of NY (Chief of the International Financial markets Division), a Fed Watcher at Irving Trust and Chief Economist at Nikko Securities International. He is widely quoted and appears in various media. Mr. Brusca holds an MA and Ph.D. in economics from Michigan State University and a BA in Economics from the University of Michigan. His research pursues his strong interests in non aligned policy economics as well as international economics. FAO Economics’ research targets investors to assist them in making better investment decisions in stocks, bonds and in a variety of international assets. The company does not manage money and has no conflicts in giving economic advice.


