 Global| Jan 29 2010
U.S. GDP Rise Is The Quickest Since 2003
by:Tom Moeller
|in:Economy in Brief
Summary
The current economic recovery picked up momentum last quarter. Constant dollar GDP rose 5.7% (AR), more-than double the 3Q growth rate and the quickest increase since 3Q 2003. Consensus expectations had been for a lesser 4.6% rise. [...]
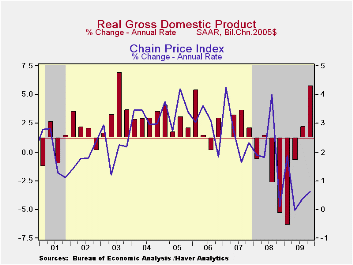
The current economic recovery picked up momentum last quarter. Constant dollar GDP rose 5.7% (AR), more-than double the 3Q growth rate and the quickest increase since 3Q 2003. Consensus expectations had been for a lesser 4.6% rise.
The principle lift to last quarter's growth was inventories. The 3.4 percentage point contribution from inventory accumulation was necessitated by vigorous decumulation dating back to 2005. It had reduced desired inventory levels too far below demand even though sales were then declining.
Improvement in the foreign trade deficit also contributed one half of a percentage point to growth last quarter as exports remained strong. The 18.1% rate of increase (-1.7% y/y) followed a 17.8% 3Q gain as the lower value of the dollar continued to improve the competitiveness of U.S. products. Real imports, conversely, rose at a lesser 10.5% rate and remained down 7.7% versus last year.
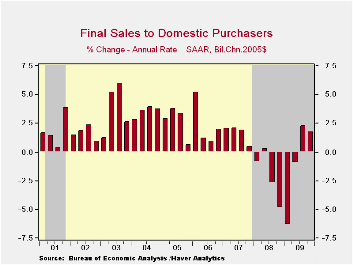
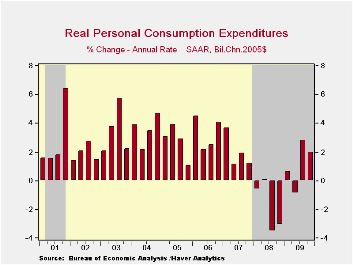
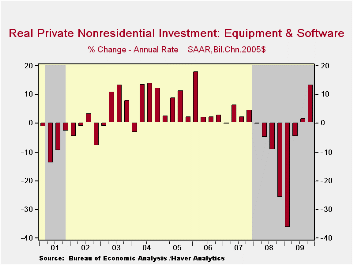
Growth in domestic final demand moderated to 1.7% after a 2.3% 3Q rise. Nevertheless, these were the first back-to-back quarterly increases since 2007. A 13.3% increase (-8.7% y/y) in business investment in equipment & software led the gain after its 1.5% 3Q rise. Investment in business construction, however, offset much of this increase with a 15.4% decline (-24.7% y/y). Residential investment also was strong and posted its second quarterly increase (-12.1% y/y). Personal consumption growth lagged with a 2.0% gain (1.1% y/y) that was dragged down by a sharp quarterly decline in spending on new autos with end of the "cash-for-clunkers" sales campaign. Spending on furniture & appliances rose for the second straight quarter (0.1% y/y) while spending on clothing surged q/q but remained down 0.7% y/y. Spending of services last quarter rose moderately (0.6% y/y). Finally, quarterly spending by governments fell slightly (+1.6% y/y), mostly due to a drop in defense spending though it remained up 3.1% y/y.
Price inflation remained moderate. The chained GDP price index rose at a 0.6% annual rate after a similarly small 3Q rise. Diminished price gains for all of last year pulled the annual increase down to 1.2% which was nearly its weakest increase since the early 1960s. The overall domestic final sales price index was basically flat for the year despite an accelerated 2.2% 4Q increase. The personal consumption chain price index rose 2.7% in 4Q but increased just 0.2% for the year.· The U.S. National Income & Product Account data are available in Haver's USECON and the USNA databases.
Focusing on Bank Interest Rate Risk Exposure is the title of this mornings speech be Fed Vice Chairman Donald L Kohn and it can be found here.
| Chained 2005$, % AR | 4Q '09 | 3Q '09 | 2Q '09 | 4Q Y/Y | 2009 | 2008 | 2007 |
|---|---|---|---|---|---|---|---|
| GDP | 5.7 | 2.2 | -0.7 | 0.1 | -2.4 | 0.4 | 2.1 |
| Inventory Effect | 3.4 | 0.7 | -1.4 | 0.0 | -0.7 | -0.4 | -0.4 |
| Final Sales | 2.2 | 1.5 | 0.7 | 0.1 | -1.7 | 0.8 | 2.5 |
| Foreign Trade Effect | 0.5 | -0.8 | 1.7 | 1.0 | 1.0 | -1.2 | 0.8 |
| Domestic Final Demand | 1.7 | 2.3 | -0.9 | -0.9 | -2.7 | -0.4 | 1.7 |
| Chained GDP Price Index | 0.6 | 0.4 | -0.0 | 0.7 | 1.2 | 2.1 | 2.9 |
by Robert Brusca January 29, 2010
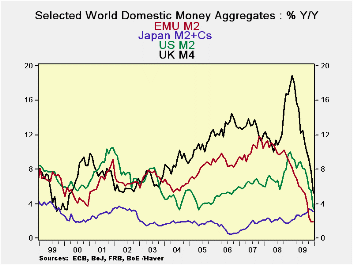
Tight money isn’t funny – With the Fed’s balance sheet bloated like glutton at a roman feast, tensions have run high on the prospects of inflation. Like Mr Creosote in the Monty Python skit everyone is sure that with the equivalent of just one wafer thin mint the whole mess will explode in a frenzy of inflation forces…. Meanwhile, back at the ranch where reality rules the roost, money supply growth rates among the world’s key industrial country aggregates is tempered, steady or falling. At the same time a rise in oil prices has given the appearance of inflation. Europe in December has just reported out its fastest rise in the CPI (HICP) in nearly one year. But Japan has posted the largest drop in inflation in the history of its CPI series that began in 1970 (a drop 1.2% in the month).
I would hope that after the last business cycle in which oil traded up nearly to $150/bbl and yet core inflation in the US and in Europe remained ‘restrained’ was a lesson to not spend so much time looking at headline inflation. Still, headline inflation has its advocates. They must be the same people who love to watch the action on those bobble-headed dolls sitting on the dashboard of a car as it travels over a bumpy road. There is not much else to commend headline inflation-watching.
Money supply, the key driver of inflation over the long haul, is not flashing any warning signals about inflation. It is giving no reason to have inflation concerns alt all. Money supply growth in the UK, in EMU and in the US has dropped its growth rate dramatically and steadily. The drop off in money growth is ONGOING in the UK, in EMU and in Japan whereas, in the US, money growth has bounced up off its six-month low to see its three-month growth rate hover at the pace of year-over-year money growth at 3.5% - hardly a barn burner.
In EMU credit growth remains restrained in terms of over overall loan growth and in terms of credit to residents. Both of these measures of credit are declining in real terms and the rate of shrinkages is either large or is accelerating from one-year to six-months to three-months. That is not a good story if you want it end with everyone living ‘happily ever after.’
Money and credit are the raw material or fuel for growth. Right now the tanks are dang near empty across the major monetary center countries. Even China has begun a program of pulling back on credit, but there it is after a period of excessive growth.
On balance for all the concerns about inflation all we really have is some volatile oil price that on occasion feeds though to bash headline inflation like cars in a long train bumping into one another on down the line, long after the locomotive has stopped. Inflation by the core measures remains tame. Inflation fundamentals are rock solid as there are huge GDP-gaps around the world and an all-too ample supply of labor. Money supply growth is tame, tempered or outright withering. Worrying about too-liquid bank reserves while banks are bottling up credit growth makes no sense at all. Yet I like to understand this fear by pointing out that a large block of the economics profession forms a school called ‘monetarism’ and if it did not register horror at the size of those bank reserves all those economists probably would have to find a new ‘religion.’ It may be in time that those reserves will be worth worrying about. Once banks lose their fear and start lending again, reserves may one again be a risk. But forest fires rarely start in the wet and rainy season; that is what we have as an economic environment right now. Inflation starting in an environment like this is really a very small risk. Conversely, it is growth that is at risk and it is lending that is needed to keep it going. So far that spark of lending is lacking just about everywhere. We should not douse a spark to warm our hands for fear of burning a forest.
| Look at Global and Euro Liquidity Trends | |||||||
|---|---|---|---|---|---|---|---|
| Saar-all | Euro Measures (E13): Money & Credit | G-10 Major Markets: Money | Memo | ||||
| €-Supply M2 | Credit:Resid | Loans | $US M2 | £UK M4 | ¥Jpn M2+Cds | OIL:WTI | |
| 3-MO | -0.7% | -0.1% | 0.3% | 3.5% | 3.1% | 1.7% | 33.5% |
| 6-MO | 0.6% | 0.1% | -0.7% | 2.0% | 5.7% | 2.4% | 15.3% |
| 12-MO | 2.0% | 0.7% | -0.2% | 3.4% | 5.3% | 3.1% | 74.0% |
| 2Yr | 5.5% | 4.1% | 2.9% | 6.5% | 10.8% | 2.4% | -9.5% |
| 3Yr | 7.1% | 7.2% | 5.6% | 6.4% | 11.2% | 2.3% | 6.3% |
| Real Balances: deflated by Own CPI. Oil deflated by US CPI | |||||||
| 3-MO | -2.8% | -2.2% | -1.8% | 0.2% | -0.1% | 2.6% | 29.2% |
| 6-MO | -0.9% | -1.4% | -2.2% | -0.9% | 2.4% | 3.7% | 12.1% |
| 12-MO | 1.0% | -0.2% | -1.1% | 0.6% | 2.4% | 4.8% | 69.3% |
| 2Yr | 4.2% | 2.8% | 1.7% | 5.1% | 7.6% | 3.1% | -10.7% |
| 3Yr | 5.2% | 5.2% | 3.7% | 4.0% | 8.2% | 2.5% | 4.0% |
by Tom Moeller January 29, 2010
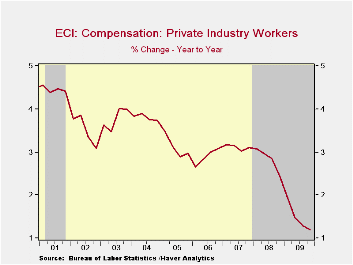 unemployment
dragged
the y/y change in the Employment Cost Index down
to its lowest on record. (The series dates back to 1980). Overall the
employment cost index for private industry workers rose 1.2% for the
year which ended with a 0.4% rise during 4Q following upwardly revised
gains during the prior two quarters. The latest rise about matched
Consensus expectations.
unemployment
dragged
the y/y change in the Employment Cost Index down
to its lowest on record. (The series dates back to 1980). Overall the
employment cost index for private industry workers rose 1.2% for the
year which ended with a 0.4% rise during 4Q following upwardly revised
gains during the prior two quarters. The latest rise about matched
Consensus expectations.
Weaker growth in both in wages and
benefits pulled the overall index lower. Wages grew just 1.5% last year
which was exactly half the 2008 gain. By the end of 2009, however,
growth did improve modestly as the recession ended. For the year
management, professional & related workers saw their wages rise
just 1.1% after a after a 3.2% gain during 2008. 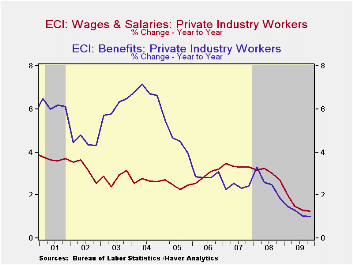 Sales & office
worker wage gains also more-than-halved to 1.0%.
Sales & office
worker wage gains also more-than-halved to 1.0%.
Total benefit costs in private sector increased just 1.2% for the year, a record low. In the management, professional & related businesses benefits grew just 0.7% but for production, transportation & materials handling industries growth held up and stable at 2.2% for the year. The cost of health benefits was an improved 4.4% in the latest 12 months.
The employment cost index figures are available in Haver's USECON database.
Myths about Budget Deficits from the American Enterprise Institute can be found here.
| ECI - Private Industry Workers (%) | 4Q '09 | 3Q '09 | 2Q '09 | 4Q Y/Y | 2009 | 2008 | 2007 |
|---|---|---|---|---|---|---|---|
| Compensation | 0.4 | 0.5 | 0.2 | 1.2 | 1.5 | 2.8 | 3.1 |
| Wages & Salaries | 0.5 | 0.5 | 0.2 | 1.3 | 1.5 | 3.0 | 3.4 |
| Benefit Costs | 0.4 | 0.3 | 0.2 | 1.0 | 1.2 | 2.6 | 2.4 |
by Tom Moeller January 29, 2010
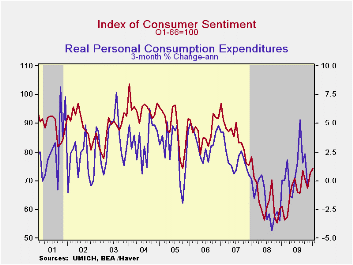 Building on gains earlier in the month consumer sentiment for
all of January rose to its highest level since January of 2008. The
Reuters/University of Michigan Index of Consumer Sentiment for all of
January rose to 74.4 from 72.5 in December. The latest figure beat
Consensus expectations for a reading of 73.0 and it was up sharply from
the low of 55.3 in November 2008.
Building on gains earlier in the month consumer sentiment for
all of January rose to its highest level since January of 2008. The
Reuters/University of Michigan Index of Consumer Sentiment for all of
January rose to 74.4 from 72.5 in December. The latest figure beat
Consensus expectations for a reading of 73.0 and it was up sharply from
the low of 55.3 in November 2008.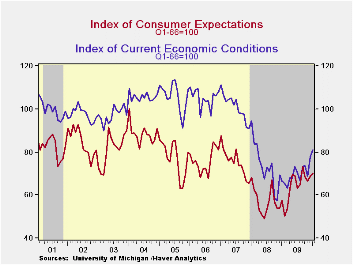 During the last ten years there has
been a two-thirds correlation between the level of sentiment and the
three-month change real consumer spending.
During the last ten years there has
been a two-thirds correlation between the level of sentiment and the
three-month change real consumer spending.
Sentiment about current economic conditions increased another
4.0% after its 13.4% jump from November. The latest was the highest
level since March of 2008. Assessments of current financial conditions
improved m/m to the highest since September of 2008. 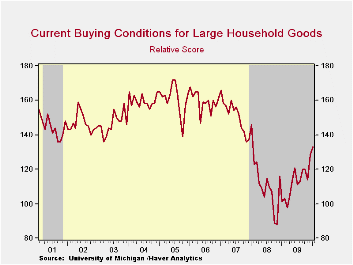 Buying conditions
for large household goods, including furniture, refrigerators, stoves
& televisions, also moved up 3.9% to the highest level since
January 2008.
Buying conditions
for large household goods, including furniture, refrigerators, stoves
& televisions, also moved up 3.9% to the highest level since
January 2008.
The January reading on expected economic conditions increased
sharply from mid-month. The 1.7% m/m increase pulled the index to its
highest level since September. Expectations for business conditions
during the next year improved and have more-than doubled since last
February.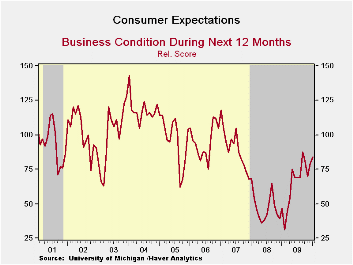 Expectations for business conditions during the next five
years also improved m/m and rose sharply from the 2008 low.
Expectations for personal finances slipped m/m to the lowest since
March 2009 as expectations for family income growth remained
moderate-to-lower.
Expectations for business conditions during the next five
years also improved m/m and rose sharply from the 2008 low.
Expectations for personal finances slipped m/m to the lowest since
March 2009 as expectations for family income growth remained
moderate-to-lower.
Expected price inflation during the next year rose m/m to 3.4% and it was up from the December 2008 reading of 1.7%.Respondents' view of government policy, which may eventually influence economic expectations, improved following the sharp December decline. Just fourteen percent of respondents thought that a good job was being done by government versus 33% who thought a poor job was being done.
| University of Michigan | January | Mid-January | December | November | Jan y/y | 2009 | 2008 | 2007 |
|---|---|---|---|---|---|---|---|---|
| Consumer Sentiment | 74.4 | 72.8 | 72.5 | 67.4 | 21.6% | 66.3 | 63.8 | 85.6 |
| Current Conditions | 81.1 | 81.0 | 78.0 | 68.8 | 22.0 | 69.6 | 73.7 | 101.2 |
| Expectations | 70.1 | 67.5 | 68.9 | 66.5 | 21.3 | 64.1 | 57.3 | 75.6 |

Tom Moeller
AuthorMore in Author Profile »Prior to joining Haver Analytics in 2000, Mr. Moeller worked as the Economist at Chancellor Capital Management from 1985 to 1999. There, he developed comprehensive economic forecasts and interpreted economic data for equity and fixed income portfolio managers. Also at Chancellor, Mr. Moeller worked as an equity analyst and was responsible for researching and rating companies in the economically sensitive automobile and housing industries for investment in Chancellor’s equity portfolio. Prior to joining Chancellor, Mr. Moeller was an Economist at Citibank from 1979 to 1984. He also analyzed pricing behavior in the metals industry for the Council on Wage and Price Stability in Washington, D.C. In 1999, Mr. Moeller received the award for most accurate forecast from the Forecasters' Club of New York. From 1990 to 1992 he was President of the New York Association for Business Economists. Mr. Moeller earned an M.B.A. in Finance from Fordham University, where he graduated in 1987. He holds a Bachelor of Arts in Economics from George Washington University.
More Economy in Brief


