 Global| Jun 28 2007
U.S. GDP Revision Ticks Growth up to +0.7%
Summary
The chart on the left overlays Yr/Yr GDP growth on Q/Q annualized GDP growth. The more volatile quarterly numbers have been slowing enough to clearly reduce the growth in Y/Y GDP to just below 2% at 1.9% in Q1 2007. However, there is [...]
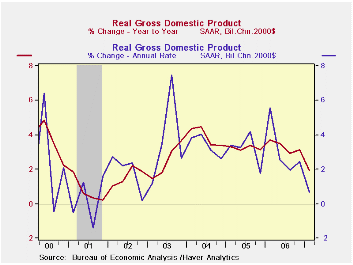
The chart on the left overlays Yr/Yr GDP growth on Q/Q annualized GDP growth. The more volatile quarterly numbers have been slowing enough to clearly reduce the growth in Y/Y GDP to just below 2% at 1.9% in Q1 2007. However, there is not much ‘GDP weakness’ left in the pipeline. In fact GDP seems to have taken much of its hit from odd places in the span of a single quarter. At 1.9% Yr/Yr GDP is weaker than each of the four annualized quarters it contains except Q1 2007. So with a better Q2 the four-quarter growth rate can easily move back up above the 2% mark. Indeed, moving up above the 0.7% mark will be a piece of cake.
Taking inventory on the downturn. The GDP slowdown is in fact made up of factors that seem unlikely to repeat. Inventory investment is the main drag on Q1 GDP at a reading of -$4.2bil and that represents a Q/Q change of -$26.6bil – it is the change in the change for inventories that feeds into GDP each quarter. So GDP suffered from its inventory malaise to the tune of minus $26.6bil not minus $4.2 bil. Inventories had grown by $22.4 bil in Q4 2006 and that was a drop off of $32bil from Q3 2006. By comparison, Q2 2006 and Q3 2006 inventory investment each were at about $55bil. So there has been an inventory correction that drastically slowed the rate of increase of inventories over the past TWO quarters and actually reduced the stock of inventories outstanding in Q1 2007.
The damage done to GDP by so few. At the same time consumer spending for goods remains strong although capital equipment spending has been limp. Inventories could continue weak but with this sort of spending on goods that is unlikely and it is more unlikely that the DROP in inventory investment (change in the change) will come anything close to the minus $26bil posted in Q1 and that means that inventories will ADD to growth in Q2 2007. Since inventories shaved 0.9% POINTS off growth in Q1 2007 that means inventories alone could add more than one percentage point to Q2 growth. Meanwhile the bulging trade gap subtracted another $23bil off from GDP or 0.8% points of growth. These two components docked GDP growth by 1.7 percentage points (saar). In other words, without these subtractions, GDP growth might have been 2.5% in Q1 2007 - hardly a disturbing number. No wonder so many economists are now changing their tune and forecasts on the economy.
Assessing the future by looking at the past. It is unrealistic to put all of those two subtractions back into GDP since while inventories cycle up and down, GDP growth makes the trade deficit bigger so we must allot some trade deterioration for each quarter due to trade unless foreign growth really picks up or US growth remains very weak. Still it is the point more than the numbers that I want to drive home.
The road ahead. To correctly assess the potential for GDP in the period ahead it is also important to gauge the Q1 2007 result Vs the trend for previous quarters. We can do that by looking at Q1 Vs the Yr/Yr by components. Except for the dollar amount comparisons – and we have talked about those above - this is what the final column in the table does (see table below).
GDP was weak in Q1 2007. Its growth rate fell short of trend by 1.2 percentage points. We can see that short fall just about (a bit less, actually) the impact of inventories and trade on the quarter. Consumer spending was strong in the quarter by a margin of 0.7 pct points (saar) over ‘trend’. Durables spending was much stronger than trend while non-durables and service sector spending were only slightly above trend. Business investment was slightly weaker relative to trend as spending on structures lagged and spending on equipment finally picked up relative to a very weak trend (it’s still not very strong). Exports were well below trend while imports were above trend. Government spending was slightly weaker than trend. The key point of this comparison is to show that GDP has not really undergone a fundamental slowing. The slowing in TOP line GDP is real and clear. But that has been the confluence of inventory and trade patterns. I view this as evidence that the economy has been working on its problems and has made a running correction, rather than as evidence of an economy running out of gas. We would expect durable goods spending by consumers to slow in Q2 but spending on non-durables and services are simply at trend. Business capital spending has begun to pick up. As the national election cycle approaches the prospect for stronger government spending is obvious. As to the international components, imports generally follow – and exceed -- trends in domestic demand; export trends have withered faster than foreign growth raising some questions on prospects there. Trade should deteriorate ahead but ‘how fast’ is still a matter of conjecture. On balance, the outlook for improved growth gotten without sticking our neck out with a wild a forecast and by looking at deviations from the past trend is actually pretty bright. Despite all the moaning about housing and sub-prime woes and higher energy prices sapping consumers, the trend in the economy shows little of that. Pessimists say the worst of it lies ahead. Optimists say worst is behind us. Pragmatists say where’s the beef? …unless they are vegetarian.
| GDP GROWTH | 2006 Q1 | 2006 Q2 | 2006 Q3 | 2006 Q4 | 2007 Q1 | 2007 Q1 | 2007 Q1 | Current | Less Prev |
| Actual/A,P,F | Actual | Actual | Actual | Actual | Advance | Prelim | Final | Yr/Yr | TREND |
| Real GDP | 5.6% | 2.6% | 2.0% | 2.5% | 1.3% | 0.6% | 0.7% | 1.9% | -1.2% |
| PCE | 4.8% | 2.6% | 2.8% | 4.2% | 3.8% | 4.4% | 4.2% | 3.5% | 0.7% |
| Durables | 19.8% | -0.1% | 6.4% | 4.4% | 7.3% | 8.8% | 8.7% | 4.8% | 3.9% |
| Nondurables | 5.9% | 1.4% | 1.5% | 5.9% | 2.9% | 3.5% | 3.2% | 3.0% | 0.2% |
| Services | 1.6% | 3.7% | 2.8% | 3.4% | 3.7% | 4.0% | 3.8% | 3.4% | 0.4% |
| Business Investment | 13.7% | 4.4% | 10.0% | -3.1% | 2.0% | 2.9% | 2.6% | 3.4% | -0.8% |
| Structures | 8.8% | 20.3% | 15.7% | 0.9% | 2.1% | 5.0% | 4.8% | 10.1% | -5.4% |
| Equipment | 15.6% | -1.4% | 7.7% | -4.8% | 1.9% | 2.0% | 1.7% | 0.7% | 1.0% |
| Housing | -0.3% | -11.1% | -18.6% | -19.8% | -17.0% | -15.4% | -15.7% | -16.4% | 0.7% |
| Inventories ($B)* | $41.2 | $53.7 | $55.4 | $22.4 | $14.8 | ($4.5) | ($4.2) | $29.9 | -- |
| Farm | $4.3 | $1.9 | $2.5 | $2.4 | $3.0 | $2.6 | $2.6 | $1.1 | -- |
| Nonfarm | $36.8 | $52.2 | $53.3 | $20.0 | $11.3 | ($7.8) | ($7.5) | ($64.0) | -- |
| Net Exports ($B)** | ($636.6) | ($624.2) | ($628.8) | ($582.6) | ($597.8) | ($611.8) | ($606.2) | $30.4 | -- |
| Exports | 14.0% | 6.2% | 6.8% | 10.6% | -1.2% | -0.6% | 0.7% | 6.0% | -5.4% |
| Imports | 9.1% | 1.4% | 5.6% | -2.6% | 2.3% | 5.7% | 5.5% | 2.4% | 3.1% |
| Government | 4.9% | 0.8% | 1.7% | 3.4% | 0.9% | 1.0% | 1.0% | 1.7% | -0.7% |
| Real Final Sales | 5.6% | 2.1% | 1.9% | 3.7% | 1.6% | 1.6% | 1.7% | 2.3% | -0.7% |
| For Yr/Yr: * average, ** Change from Yr ago Qtr | |||||||||

Robert Brusca
AuthorMore in Author Profile »Robert A. Brusca is Chief Economist of Fact and Opinion Economics, a consulting firm he founded in Manhattan. He has been an economist on Wall Street for over 25 years. He has visited central banking and large institutional clients in over 30 countries in his career as an economist. Mr. Brusca was a Divisional Research Chief at the Federal Reserve Bank of NY (Chief of the International Financial markets Division), a Fed Watcher at Irving Trust and Chief Economist at Nikko Securities International. He is widely quoted and appears in various media. Mr. Brusca holds an MA and Ph.D. in economics from Michigan State University and a BA in Economics from the University of Michigan. His research pursues his strong interests in non aligned policy economics as well as international economics. FAO Economics’ research targets investors to assist them in making better investment decisions in stocks, bonds and in a variety of international assets. The company does not manage money and has no conflicts in giving economic advice.
More Economy in Brief


