 Global| Sep 27 2018
U.S. GDP Growth Unrevised; Profits Revised Slightly Lower
Summary
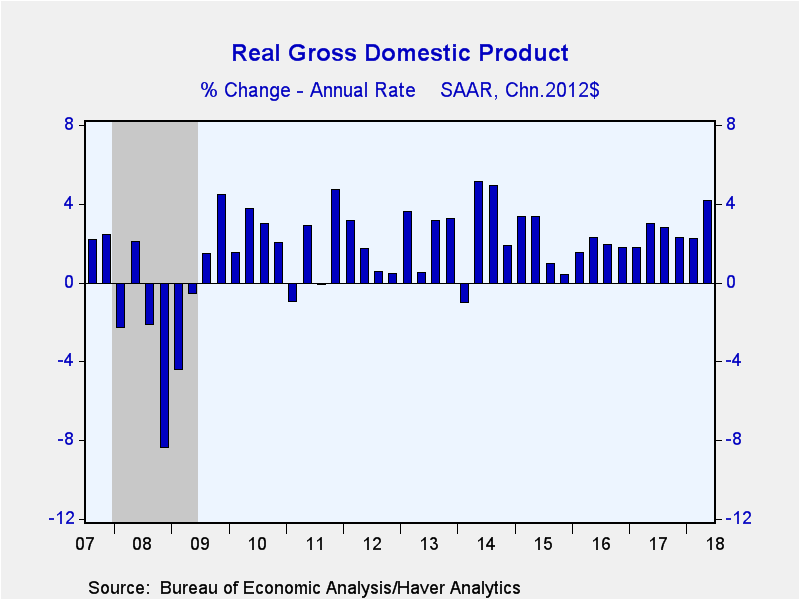
Real gross domestic product grew at an unrevised 4.2% annual rate in Q2'18 (2.9% year-on-year) in line with the expectations of the Action Economics Forecast Survey. This is the strongest quarterly growth rate since Q3'14 when the [...]
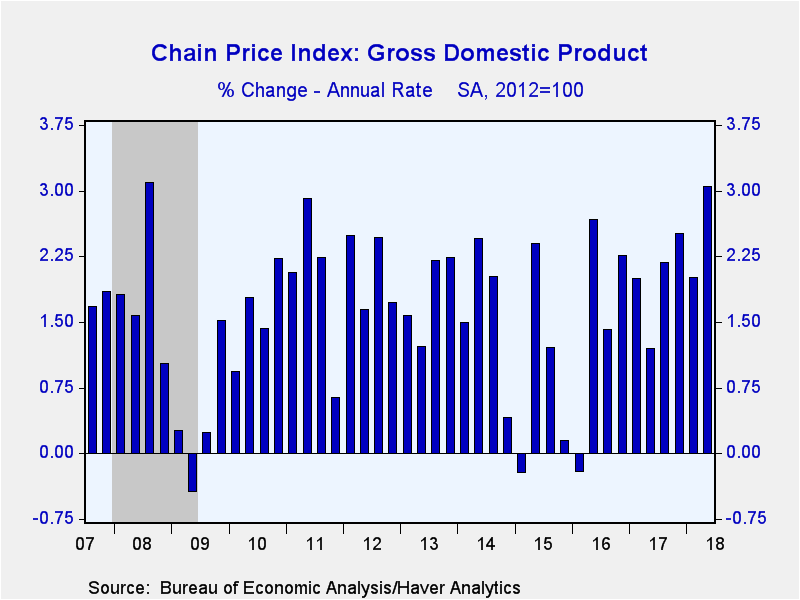
Real gross domestic product grew at an unrevised 4.2% annual rate in Q2'18 (2.9% year-on-year) in line with the expectations of the Action Economics Forecast Survey. This is the strongest quarterly growth rate since Q3'14 when the economy grew 4.9% (in Q2'15 GDP was up 3.4% y/y). Final sales increased at a slightly faster 5.4% (3.1% y/y), but was offset by an even larger 1.2 percentage point drag from inventories (was 1.0 ppt). The GDP price index increased an unrevised and expected 3.0% (2.4% y/y). It was the strongest gain since Q3'08 (GDP inflation was 2.5% y/y in Q4'07).
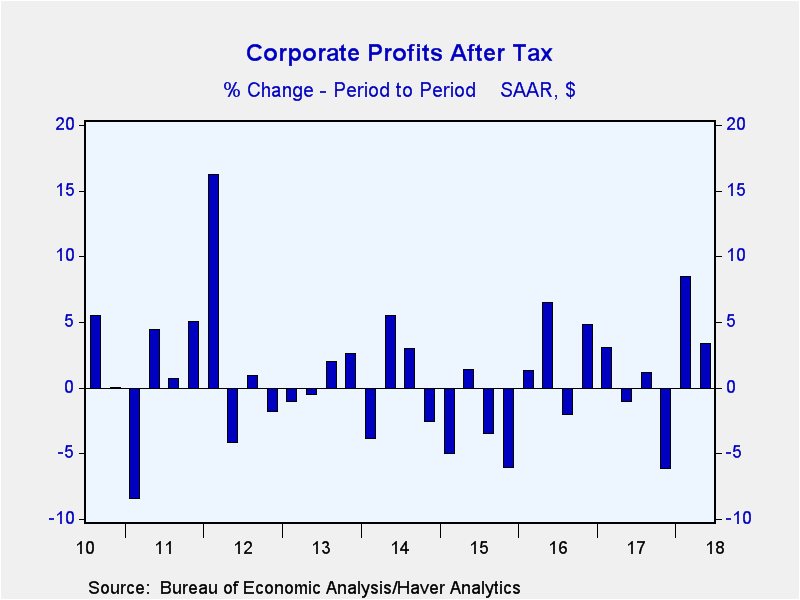
After tax corporate profits were revised down to 2.1% quarterly non-annualized growth (15.8% y/y), from the initially reported 2.4% gain. Still, this is the fastest year-on-year growth since Q1'12. Pretax profits increased a downwardly revised 3.0% (was 3.3%) and 7.3% y/y. Pretax earnings in the nonfinancial sector grew an improved 5.2% (-10.4% y/y). Financial sector profits increased 3.8% (-1.5% y/y), while foreign sector earnings declined 0.9% (+15.0% y/y).
Personal consumption expenditures strengthened an unrevised 3.8% annual rate (2.6% y/y), led by an 8.6% surge (6.6% y/y) in spending on durable goods. Spending across all categories of durable goods was strong, with a notable 16.1% (9.7% y/y) increase in the "other" category, which includes items such as jewelry (16.8% and 12.0% y/y). Nondurable goods buying advanced 4.0% (2.6% y/y). Outlays on services gained 3.0% (2.0% y/y). Health care purchases increased 2.1% (2.8% y/y) while spending on housing & utilities improved 2.3% (1.3% y/y).
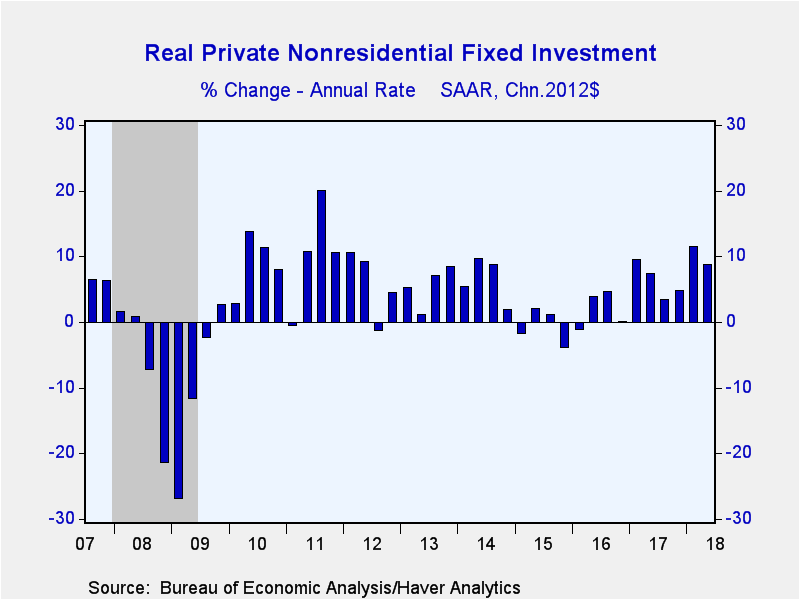
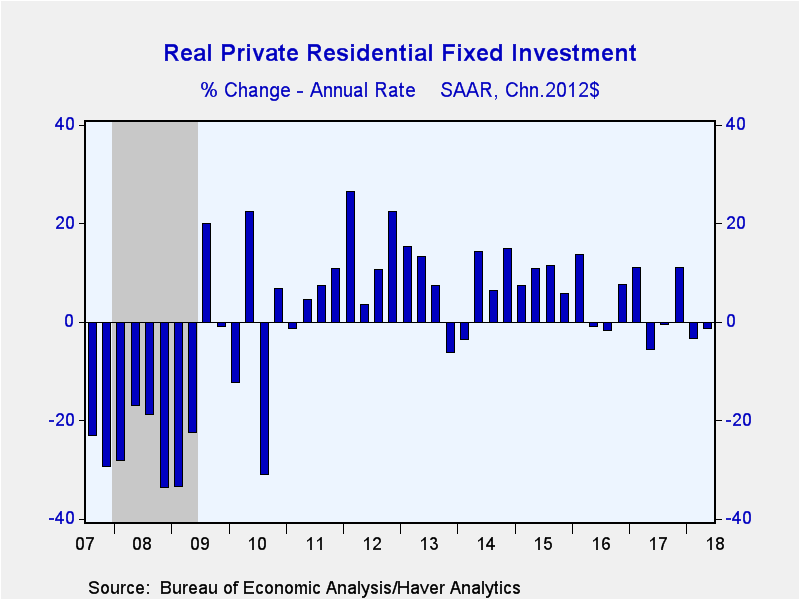
Nonresidential business fixed investment grew an upwardly revised 8.7% (was 8.5%) and 7.1% y/y. Spending on structures jumped 14.5% (5.6% y/y) driven by a 95.4% jolt (34.3% y/y) in drilling activity resulting from the increase in oil prices. Equipment investment rose 4.6% (8.2% y/y), as tech hardware gained 10.5% quarter-to-quarter and y/y. Intellectual property products investment improved 10.5% (6.6% y/y), led by a 12.6% (9.7% y/y) gain in software investment. Residential investment declined 1.4% (+1.3% y/y), down for the fourth quarter in the last five.
Government sector outlays increased 2.5% (1.3% y/y) led by a 3.6% rise (2.2% y/y) in federal government purchases. National defense spending strengthened 5.9% (2.2% y/y), the largest quarterly rise in nine years. State & local government spending increased 1.9% (0.8% y/y).
The improvement in the foreign trade deficit added an unrevised 1.2 percentage points to GDP growth last quarter. Exports surged 9.3% (5.7% y/y), as a result of a 13.5% jump in goods exports (7.3% y/y). In particular, exports of foods, feeds & beverages soared 109.6% (16.4%). Meanwhile, imports edged 0.6% lower (+4.2% y/y).
Consumer prices as measured by the PCE price index increased an upwardly revised 2.0% (was 1.9%) and 2.2% y/y. The core PCE index grew a slightly faster 2.1% (was 2.0%) and 1.9% y/y. The nonresidential business fixed investment price index rose 2.0% (1.2% y/y) while the residential investment price index surged 7.3% (5.9% y/y). The export price index strengthened 5.8% (4.9% y/y), while import prices rose just 0.8% (3.7% y/y).
The GDP figures can be found in Haver's USECON and USNA database. USNA contains virtually all of the Bureau of Economic Analysis' detail in the national accounts. Both databases include tables of the newly published not seasonally adjusted data. The Action Economics consensus estimates can be found in AS1REPNA.
Gerald D. Cohen
AuthorMore in Author Profile »Gerald Cohen provides strategic vision and leadership of the translational economic research and policy initiatives at the Kenan Institute of Private Enterprise.
He has worked in both the public and private sectors focusing on the intersection between financial markets and economic fundamentals. He was a Senior Economist at Haver Analytics from January 2019 to February 2021. During the Obama Administration Gerald was Deputy Assistant Secretary for Macroeconomic Analysis at the U.S. Department of Treasury where he helped formulate and evaluate the impact of policy proposals on the U.S. economy. Prior to Treasury, he co-managed a global macro fund at Ziff Brothers Investments.
Gerald holds a bachelor’s of science from the Massachusetts Institute of Technology and a Ph.D. in Economics from Harvard University and is a contributing author to 30-Second Money as well as a co-author of Political Cycles and the Macroeconomy.
More Economy in Brief
 Global| Feb 05 2026
Charts of the Week: Balanced Policy, Resilient Data and AI Narratives
by:Andrew Cates


