 Global| Mar 26 2010
U.S. GDP 4Q Increase IsLowered Slightly; Profits Are Firm
by:Tom Moeller
|in:Economy in Brief
Summary
Last quarter was a strong one for the U.S. economy and the revised picture is little different from the one depicted earlier. The latest revision, however, lowered the growth rate slightly to 5.6% from 5.9%. Nevertheless, last [...]
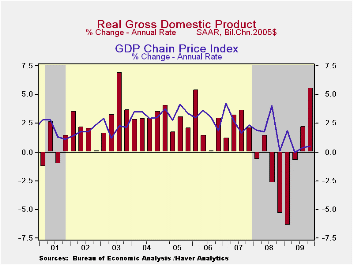
Last quarter was a strong one for the U.S. economy and the revised picture is little different from the one depicted earlier. The latest revision, however, lowered the growth rate slightly to 5.6% from 5.9%. Nevertheless, last quarter's growth remained the best since 3Q 2003 and it pushed the y/y change into (slightly) positive territory for the first time since early-2008. The revision exceeded Consensus expectations for 5.9% growth.
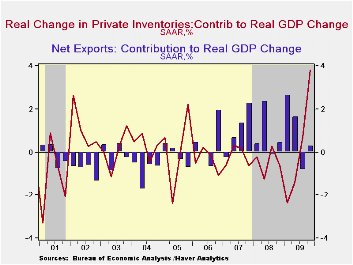
The addition to growth from inventories was notched down to 3.8 percentage points. The strength in rebuilding was necessitated by vigorous and unprecedented decumulation dating back to 2005.
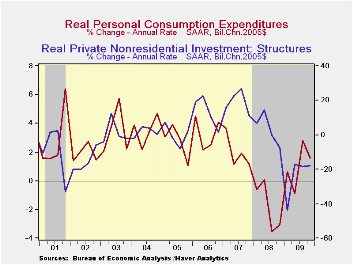
Growth in domestic final demand also was shaved to a still slow 1.4% from 1.6%. Business investment in equipment & software was revised up slightly to 19.0% (-7.5% y/y) after a 1.5% 3Q rise. Investment in business construction, however, offset much of this increase with a 18.1% decline (-25.3% y/y) which was more than estimated last month. Growth in residential investment also was revised down to 3.7% (-12.6% y/y) though it remains the second consecutive quarterly increase. Personal consumption growth was little revised at 1.6% (1.0% y/y) following a 2.8% 3Q increase. Finally, government spending dropped an unrevised 1.3% (+1.3% y/y), led by a decline in defense spending as well as lower spending by state and local governments.
Improvement in the foreign trade deficit added an unrevised 0.3 percentage points to last quarter's gain in GDP. Strong growth in exports of 22.8% (-0.7% y/y) was little changed. That surge was offset, however, by a 15.8% (-6.6% y/y) jump in imports.
Price inflation was revised slightly higher to 0.5% as measured by the chained GDP price index. Diminished price gains for all of last year pulled the annual increase down to 1.2% which was nearly its weakest increase since the early-1960s. The personal consumption chain price index rose a quickened 2.1%. However, it increased just 0.2% for the whole year owing to the yearly decline in energy prices. The price index for fixed business investment fell 1.4% (-2.9% y/y), the fourth consecutive quarterly decline. A 2.7% increase (-2.6% y/y) in the residential investment price index offset a 3Q decline.
Corporate profits rose 8.0% (30.6% y/y) last quarter. The gain was driven by an 18.6% jump in financial sector earnings, which are up more than three-fold during the last year due to lower interest rates. Nonfinancial sector earnings benefitted from the economic recovery and cost cutting. The 8.7% (11.5% y/y) increase was offset, however, by a 5.0% decline (-7.6% y/y) in repatriated foreign sector profits.

| Chained 2005$, % AR | 4Q '09 Final | 4Q '09 Preliminary | 4Q '09 Advance |
3Q '09 | 4Q Y/Y | 2009 | 2008 | 2007 |
|---|---|---|---|---|---|---|---|---|
| GDP | 5.6 | 5.9 | 5.7 | 2.2 | 0.1 | -2.4 | 0.4 | 2.1 |
| Inventory Effect | 3.8 | 3.9 | 3.4 | 0.7 | 0.2 | -0.7 | -0.4 | -0.4 |
| Final Sales | 1.7 | 1.9 | 2.2 | 1.5 | -0.1 | -1.7 | 0.8 | 2.5 |
| Foreign Trade Effect | 0.3 | 0.3 | 0.5 | -0.8 | 0.9 | 1.0 | -1.2 | 0.8 |
| Domestic Final Demand | 1.4 | 1.6 | 1.7 | 2.3 | -1.0 | -2.7 | -0.4 | 1.7 |
| Chained GDP Price Index | 0.5 | 0.4 | 0.6 | 0.4 | 0.7 | 1.2 | 2.1 | 2.9 |
by Robert Brusca March 26, 2010
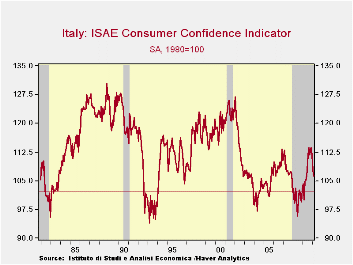
Italian consumers used to feel better. They used to feel a lot better just a few short months ago. In December of 2009 at a level of 113.6 Italy’s consumer confidence measure compiled by ISAE hit what is for now its cycle high. That reading had barely surpassed the December 2006 confidence peak-reading of 113.4. But December 2009 stood as the best reading since July 2002 and all seemed good. In retrospect, Italy’s funk goes back to that late 2000 transitional period when confidence dropped from very strong levels to begin its period of what has been readings that have persisted at much lower levels. For Italy it’s problems are not just the financial crisis and economic recovery.
Now it is clear that the bloom is off the consumer’s rose. That rose seemed to bloom early and with all of Italy’s troubles it was hard to tell what the real truth was. The truth appears to be that Italy’s consumers were overly optimistic or actually in denial. Their spirits are now deflating fast.
Italian consumers rate the past twelve months as better in March than they did in February. But that was only a 61st percentile of the range response. In March, looking to the more important next 12-months, the overall rating remains what is was in February but that is a lower 34th percentile of range response. In other words the level of the reading is nearly in the lower one-third of its range. Expectations of unemployment are up and that reading is in the top 2% of its range. Unemployment fears have really ratcheted up in Italy. It’s possible that events in fellow Mediterranean country Greece are having some chilling knock-on effects.
Despite these responses consumers rate their household finances as one point improved over the next 12-months compared to last month’s outlook reading; it’s a 36 range percentile assessment. Households also rate current savings as high, in the top 7% of their range, but future savings are rated in the bottom 25th percentile of their range. But where the rubber hits the road and the spending environment is assessed Italian consumers place the assessment right in the middle at the 54th percentile of the range. Good time to spend? Mezzo-mezzo.
There is a lot of confusion in Italy about where the country is going and how fast. There is a lot of concern about unemployment. Recent events in the e-Zone must have Italians worried; they can see that if they slip-up there is no safety net that will be thrown under them, maybe a blanket thrown over them after-the-fact. The thought is chilling. Not even pasta can salve the pain.
| Italy ISAE Consumer Confidence | |||||||
|---|---|---|---|---|---|---|---|
| Since 1992 | Rank | ||||||
| Mar-10 | Feb-10 | Jan-10 | Dec-09 | Percentile | Rank | percentile | |
| Consumer Confidence | 106.3 | 107.7 | 111.6 | 113.6 | 37.4 | 146 | 31.5% |
| Last 12 months | |||||||
| OVERALL SITUATION | -63 | -67 | -54 | -57 | 67.2 | 83 | 61.0% |
| PRICE TRENDS | -41.5 | -45 | -38 | -41 | 12.6 | 206 | 3.3% |
| Next 12months | |||||||
| OVERALL SITUATION | -14 | -14 | -1 | -1 | 39.7 | 140 | 34.3% |
| PRICE TRENDS | 17 | 16 | 11.5 | 8.5 | 39.5 | 48 | 77.5% |
| UNEMPLOYMENT | 26 | 25 | 16 | 16 | 82.4 | 4 | 98.1% |
| HOUSEHOLD BUDGET | 0 | 2 | -1 | 1 | 16.3 | 202 | 5.2% |
| HOUSEHOLD FIN SITUATION | |||||||
| Last 12 months | -38 | -39 | -36 | -37 | 36.7 | 138 | 35.2% |
| Next12 months | -6 | -7 | -6 | -3 | 59.2 | 136 | 36.2% |
| HOUSEHOLD SAVINGS | |||||||
| Current | 69 | 73 | 78 | 73 | 81.7 | 13 | 93.9% |
| Future | -29 | -24 | -23 | -20 | 43.2 | 159 | 25.4% |
| MAJOR Purchases | |||||||
| Current | -40 | -39 | -36 | -38 | 47.1 | 98 | 54.0% |
| Total number of months: Back to Jul-92 | |||||||
by Tom Moeller
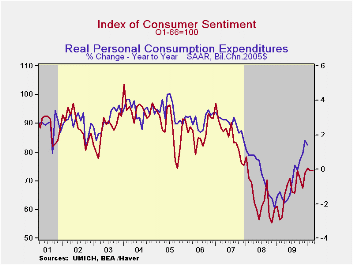
Consumer sentiment isn't exactly ebullient, but it is improved. The University of Michigan reported that its index of consumer sentiment for the full month of March held steady at 73.6 with February. That was, however, up from the mid-month reading and up considerably from the low late in 2008. The figure was slightly higher than Consensus expectations. The index reached a high of 74.4 this past January. During the last ten years there has been a 90% correlation between the level of sentiment and the y/y change in real consumer spending.
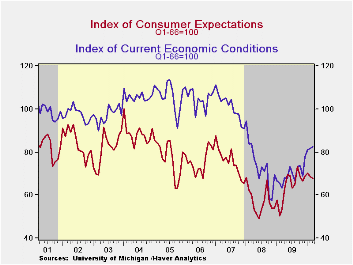
The index of expected economic conditions slipped 0.7% m/m. Expectations for business conditions fell both for the next year fell (+77.3% y/y) and for the next five years (+30.2% y/y) as well. Expectations for personal finances improved (7.7% y/y) to the highest level this year.
Sentiment about current economic conditions rose just slightly (30.2% y/y) for the second month. The assessment of current personal finances (20.3% y/y) recouped a February decline and buying conditions for large household goods, including furniture, refrigerators, stoves & televisions (38.8% y/y) were unchanged.
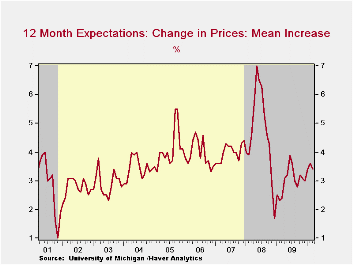
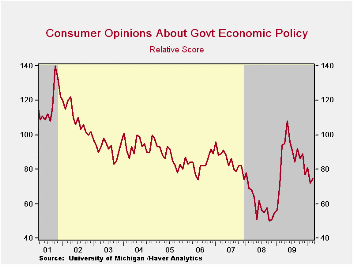
Expected price inflation during the next year slipped to 3.4% but was up from the December 2008 reading of 1.7%.Respondents' view of government policy, which may eventually influence economic expectations, improved slightly m/m but remained down 30.6% from its high last May. Fifteen percent of respondents thought that a good job was being done by government versus 40% who thought a poor job was being done, a twelve-month high.
| University of Michigan | March | Mid-March | February | January | March y/y | 2009 | 2008 | 2007 |
|---|---|---|---|---|---|---|---|---|
| Consumer Sentiment | 73.6 | 72.5 | 73.6 | 74.4 | 28.4% | 66.3 | 63.8 | 85.6 |
| Current Conditions | 82.4 | 80.8 | 81.8 | 81.1 | 30.2 | 69.6 | 73.7 | 101.2 |
| Expectations | 67.9 | 67.2 | 68.4 | 70.1 | 26.9 | 64.1 | 57.3 | 75.6 |

Tom Moeller
AuthorMore in Author Profile »Prior to joining Haver Analytics in 2000, Mr. Moeller worked as the Economist at Chancellor Capital Management from 1985 to 1999. There, he developed comprehensive economic forecasts and interpreted economic data for equity and fixed income portfolio managers. Also at Chancellor, Mr. Moeller worked as an equity analyst and was responsible for researching and rating companies in the economically sensitive automobile and housing industries for investment in Chancellor’s equity portfolio. Prior to joining Chancellor, Mr. Moeller was an Economist at Citibank from 1979 to 1984. He also analyzed pricing behavior in the metals industry for the Council on Wage and Price Stability in Washington, D.C. In 1999, Mr. Moeller received the award for most accurate forecast from the Forecasters' Club of New York. From 1990 to 1992 he was President of the New York Association for Business Economists. Mr. Moeller earned an M.B.A. in Finance from Fordham University, where he graduated in 1987. He holds a Bachelor of Arts in Economics from George Washington University.
More Economy in Brief


