 Global| Jul 07 2008
U.S. Gasoline Prices Up - Driving Down
by:Tom Moeller
|in:Economy in Brief
Summary
Perhaps 2.2% doesn't sound like much, but as a measure of the degree motor vehicle miles driven in the U.S.has fallen, it continues an unprecedented decline in demand. That follows an inexorable rise in vehicle miles driven. Just [...]
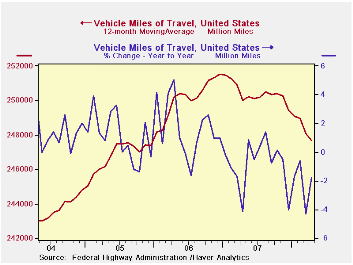
Perhaps 2.2% doesn't sound like much, but as a measure of the degree motor vehicle miles driven in the U.S.has fallen, it continues an unprecedented decline in demand. That follows an inexorable rise in vehicle miles driven. Just since 1993, total mileage driven (the distances traveled by an increasing number of vehicles) had risen by one-third.
And it wasn't just the latest spike in prices that affected drivers' behavior. The twelve-month average of vehicle miles driven peaked back in late-2006. Since that all-time peak, vehicle miles are down 1.5%.
Last month, gasoline prices moved above $4.00 per gallon
(which was double their average price in 2005). In response, vehicle
miles driven fell 2.2% from the first four months of 2007. As further
emphasis of the degree to which vehicle miles fell, 2008's first four
months' total miles driven was the lowest in three years. (The data for
this past May will be available in roughly two weeks in Haver's
USECON data base under "Other Stats.") 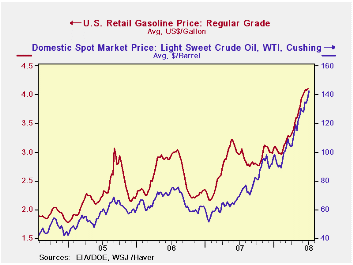
Comments made this past April from the U.S. Department of Energy regarding gasoline prices can be found here.
In addition to driving fewer miles, motorists responded by buying fewer of the less fuel efficient light trucks. Data released last week indicate that June sales of light trucks overall fell to their lowest level since 1995 (-24.3% y/y). The relatively fuel inefficient U.S. made trucks fared even worse. Domestic light truck sales of 4.98 mil. (AR) units were at their lowest level since 1993 (-24.6% y/y). Sales of imported light trucks also were hit and show a 22.8% y/y decline. But the decline was from record levels in 2007.
Clearly, the rise in crude oil prices is behind the surge in gasoline prices. Near $140 per barrel the cost of a barrel light sweet crude (WTI) was double that of a year ago.
Crude Awakening: Behind the Surge in Oil Prices from the Federal Reserve Bank of Dallas can be found here.
| April | March | April '07 | 2007 | 2006 | 2005 | |
|---|---|---|---|---|---|---|
| U.S. Vehicle Miles Traveled (million) | 245,888 | 246,182 | 250,616 | 2,993,100 | 3,018,390 | 2,968,576 |
| Year-to-Year | -1.8% | -4.3% | -4.2% | -0.8% | 1.7% | 1.1% |
by Louise Curley July 7, 2008
Data on May industrial production for Germany, the United Kingdom and Norway were released today.
Industrial production in Germany and in the UK declined more
sharply in May than the consensus in each country had expected. In
Germany, the decline from April to May was 2.4% compared with a
consensus expectation of a 0.5% decline. The actual decline was the
steepest decline since August, 1997. Part of the decline may have been
due to the fact that many workers took two days off between a Wednesday
holiday and the weekend. In the UK, the decline was 0.8% compared with
a consensus estimated decline of 0.2%. 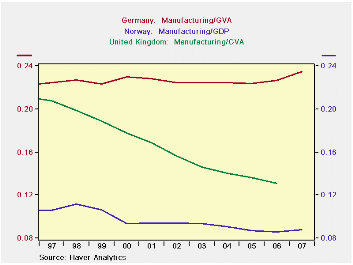
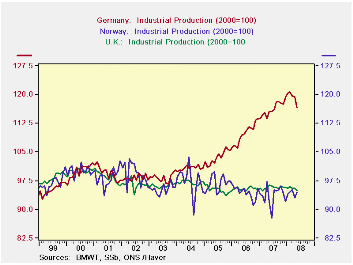
In contrast to the May declines in Germany and the UK, industrial production in Norway rose 1.7%. The longer term trends in industrial production in the three countries are shown in the first chart. (The original base for Norway's index (1995=100) and the UK's, (2003=100) have been changed to (2000=100) to facilitate comparison with Germany, whose base is (2000=100).) Since 2004, the trend in industrial production in Germany has been sharply upwards while those in the U.K. and Norway have tended downward.
Manufacturing is much more important in the German economy
than it is in either of the economies of the U.K. or Norway. The second
chart shows the importance of manufacturing in the three countries. In
Germany the ratio of manufacturing to Gross Value Added has been
relatively steady over the past ten years, just below 24%. In the U.K.
the share of manufacturing has declined steadily as the service sector
has increased. Manufacturing is currently only about 13% of the total
economy. In Norway oil and gas extraction and services dominate the
economy and manufacturing plays a small roll, accounting for only about
9% of the economy.
| INDUSTRIAL PRODUCTION (2000=100) | May 08 | Apr 08 | May 07 | M/M Chg | Y/Y Chg | 2007 | 2006 | 2005 |
|---|---|---|---|---|---|---|---|---|
| Germany | 116.5 | 119.4 | 115.6 | -2.43 | 0.78 | 116.3 | 109.8 | 103.6 |
| United Kingdom | 94.86 | 95.63 | 96.40 | -0.81 | -1.6 | 65.7 | 95.4 | 95.2 |
| Norway | 64.55 | 93.02 | 92.12 | 1.65 | 2.64 | 93.7 | 94.4 | 96.8 |
by Robert Brusca July 7, 2008
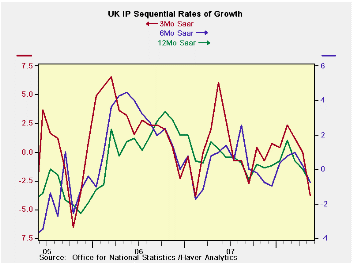
UK IP is now lower in two of the past three months. The three-month moving average has turned negative. Weakness in the industrial economy is now spreading and deepening. The consumer sector is leading the weakness. Consumer durable goods output is down in seven of the last eight months on a Yr/Yr basis. Consumer nondurables are down yr/yr in six of the last eight months but also in eight of the last 10 months (Yr/Yr basis as well). Intermediate goods output is off in two of the past three-months Yr/Yr. While capital goods output has fallen in May on a Yr/Yr basis for the first time since December 2005.
The declines in output the current quarter (2008-Q2) are severe. For MFG the drop is -1.8% at an annual rate. Consumer durable goods output is off at a 9.4% pace in the quarter. Nondurables output is off at a 2.9% pace. Intermediate goods output is falling at a 3.3% pace. Capital goods output is rising at a 2.0% pace.
The UK is showing both inflation pressures and economic weakness. The weakness in the UK is more severe than what Europe has showed, at least as a whole. Still, the UK like Europe continues to show capital goods as the strongest sector. In this month’s report that strength is clearly on the decline.
| UK IP and MFG | ||||||||||
|---|---|---|---|---|---|---|---|---|---|---|
| Saar except m/m | Mo/Mo | May 08 |
Apr 08 |
May 08 |
Apr 08 |
May 08 |
Apr 08 |
|||
| UK MFG | May 08 |
Apr 08 |
Mar 08 |
3Mo | 3Mo | 6mo | 6mo | 12mo | 12mo | Q1 Date |
| MFG | -0.6% | 0.1% | -0.5% | -3.8% | 0.0% | -0.8% | 0.2% | -0.8% | 0.0% | -1.8% |
| Consumer | ||||||||||
| Consumer Durables | -0.1% | -0.6% | -2.9% | -13.5% | -7.4% | 1.6% | -1.2% | -1.2% | -3.5% | -9.4% |
| Consumer-Nondurables | -0.8% | -0.1% | -0.4% | -5.1% | 0.0% | -2.0% | 0.2% | -1.7% | -0.4% | -2.9% |
| Intermediate | -1.0% | 0.1% | -0.5% | -5.4% | -1.3% | -3.8% | -2.7% | -2.3% | 0.3% | -3.3% |
| Capital | -0.7% | 0.7% | 0.0% | 0.0% | 3.7% | 1.1% | 0.7% | -0.1% | 0.8% | 2.0% |
| Memo: Detail | 1Mo% | 1Mo% | 1Mo% | 3Mo | 3Mo | 6mo | 6mo | 12mo | 12mo | Q4 Date |
| Food Drink & tobacco | -0.3% | -0.4% | -0.4% | -4.3% | -0.4% | -1.0% | 0.4% | -1.4% | -1.7% | -2.8% |
| Textile & Leather | -0.3% | 0.1% | 0.3% | 0.5% | 6.5% | 4.4% | 1.8% | 0.6% | 3.6% | 2.6% |
| Motor Vehicles & trailer | -3.7% | 1.9% | -1.0% | -11.0% | 11.4% | 2.9% | 5.1% | 5.1% | 9.4% | -0.3% |
| Mining and Quarry | 0.7% | -0.1% | 0.3% | 3.4% | -3.3% | -5.8% | -12.2% | -7.0% | -5.7% | 0.3% |
| Electricity, Gas & Water | -5.2% | 1.3% | -1.0% | -18.2% | 3.7% | -10.3% | -1.2% | -3.7% | 7.3% | -8.2% |

Tom Moeller
AuthorMore in Author Profile »Prior to joining Haver Analytics in 2000, Mr. Moeller worked as the Economist at Chancellor Capital Management from 1985 to 1999. There, he developed comprehensive economic forecasts and interpreted economic data for equity and fixed income portfolio managers. Also at Chancellor, Mr. Moeller worked as an equity analyst and was responsible for researching and rating companies in the economically sensitive automobile and housing industries for investment in Chancellor’s equity portfolio. Prior to joining Chancellor, Mr. Moeller was an Economist at Citibank from 1979 to 1984. He also analyzed pricing behavior in the metals industry for the Council on Wage and Price Stability in Washington, D.C. In 1999, Mr. Moeller received the award for most accurate forecast from the Forecasters' Club of New York. From 1990 to 1992 he was President of the New York Association for Business Economists. Mr. Moeller earned an M.B.A. in Finance from Fordham University, where he graduated in 1987. He holds a Bachelor of Arts in Economics from George Washington University.
More Economy in Brief


