 Global| Sep 23 2008
U.S. Gasoline Prices Down Last Week With Lessened Demand
by:Tom Moeller
|in:Economy in Brief
Summary
Last week, the U.S. pump price for a gallon of regular gasoline reversed most of the prior period's strength. It fell twelve cents to an average of $3.72, according to the U.S. Department of Energy survey. The price still was [...]
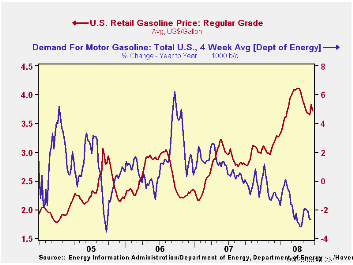
Last week, the U.S. pump price for a gallon of regular gasoline reversed most of the prior period's strength. It fell twelve cents to an average of $3.72, according to the U.S. Department of Energy survey. The price still was elevated, however, by damage to refineries caused by Hurricane Ike. For all grades of gasoline the average price similarly fell last week by twelve cents to $3.77 per gallon.
Yesterday the spot market price for regular gasoline jumped by seven cents to $2.77 per gallon. That followed a twelve cent rise last Friday. Nevertheless, the latest rise left spot prices slightly below the level of last Wednesday. In futures trading the November contract was stronger and rose thirteen cents to $2.68 per gallon, the highest level since early-September.
Weekly gasoline prices can be found in Haver's WEEKLY database, daily prices are in the DAILY database.
According to the U.S. Department of Energy, the demand
for gasoline fell 1.4% during the last four weeks. That was
the largest weekly decline in a year and for the most part it reflected
the seasonal decline in driving. Year-to-year, however, the drop still
left gasoline demand off 2.67% year-to-year.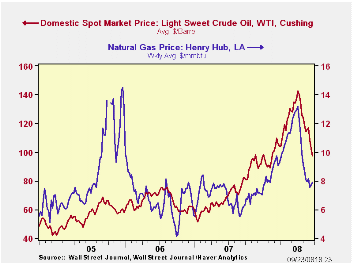
The DOE figures are available in Haver's OILWKLY database.
The price for a barrel of West Texas Intermediate crude oil fell last week to an average $97.29 per barrel. That's down from the high in July of $145.66.
Yesterday, the price for crude oil jumped to $16.40 per barrel from Friday to $120.92. That was the highest close since late-August. The two-month futures price, however, was less strong and rose $6.60 per barrel to $109.37.
Last week, prices for natural gas ticked up twenty cents w/w to an average $7.90 per mmbtu (+27.2% y/y). Prices reversed that strength yesterday and fell back to $7.67/mmbtu. The high for natural gas prices was in early-July at $13.19/mmbtu.
This morning's testimony by Fed Chairman Ben S. Bernanke on U.S. financial markets can be found here.
| Weekly Prices | 09/22/08 | 09/15/08 | Y/Y | 2007 | 2006 | 2005 |
|---|---|---|---|---|---|---|
| Retail Regular Gasoline ($ per Gallon) | 3.72 | 3.84 | 32.2% | 2.80 | 2.57 | 2.27 |
| Light Sweet Crude Oil, WTI ($ per bbl.) | 97.29 | 102.85 | 18.4% | 72.25 | 66.12 | 56.60 |
by Tom Moeller September 23, 2008
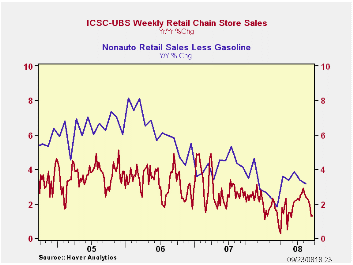
The International Council of Shopping Centers reported that chain store sales fell 1.0% last week after an even sharper 1.6% drop during the week prior. The weakness of sales for September so far is reflected in a decline which averaged 1.5% from the August average following that month's 0.2% uptick.
Year-to-year growth in sales eased to 1.3% from the recent peak rate of growth of 2.9%. That compares to a slowdown in the growth in August nonauto retail sales less gasoline, as reported by the Commerce Department, to 3.2% y/y from 4.1% during all of 2007. During the last ten years there has been a 45% correlation between the y/y change in chain store sales and the change in nonauto retail sales less gasoline.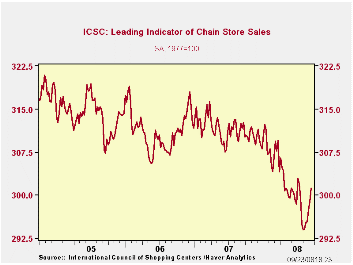
The ICSC-UBS retail chain-store sales index is constructed using the same-store sales (stores open for one year) reported by 78 stores of seven retailers: Dayton Hudson, Federated, Kmart, May, J.C. Penney, Sears and Wal-Mart.
The leading indicator of chain store sales from ICSC-UBS improved 0.8% (-3.4% y/y). The latest was the highest level since mid-July.
The chain store sales figures are available in Haver's SURVEYW database.
Do Oil Prices Directly Affect the Stock Market? from the Federal Reserve Bank of Cleveland is available here.
Trend Unemployment and What It Says about Unemployment Patterns, also from the Federal Reserve Bank of Cleveland can be found here.
| ICSC-UBS (SA, 1977=100) | 09/20/08 | 09/13/08 | Y/Y | 2007 | 2006 | 2005 |
|---|---|---|---|---|---|---|
| Total Weekly Chain Store Sales | 481.7 | 486.6 | 1.3% | 2.8% | 3.3% | 3.6% |
by Louise Curley September 23, 2008
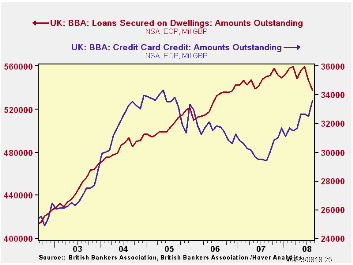
August data on bank lending to individuals for mortgages and consumer credit were released today by the British Banking Association (BBA), a trade association which comprises Britain's biggest banks.
According to the BBA report, mortgage lending by banks
declined by 8.6 billion pounds in August and was 12.7 billion below the
level of August 2007. Bank lending on credit cards, however, rose 1.1
billion pounds in August and was 4.2 billion pounds higher than August
2007. Outstanding loans on mortgage and credit cards are shown in the
first chart. Other consumer credit loans -- overdrafts and structured
loans to individuals -- were both off slightly in August and from a
year ago, as noted in the table below.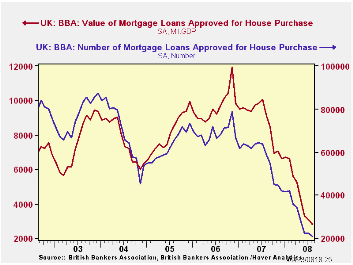
The decline in outstanding mortgage debt has been due to the decline in the number and value of mortgage approvals. Both have declined sharply since the end of 2006. The number of approvals fell another 5.2% in August and was 64.0% below August 2007. The value of mortgages approved fell 8.8% in August and was 69.1% below August, 2007. Both the number and the value of approvals are currently at the lowest points ever recorded since the series were first begun in September 1997.
| UK BANK LENDING BRITISH BANKING ASSOCIATION | Aug 08 | Jun 08 | Jul 07 | M/M chg | Y/Y chg | 2007 | 2006 | 2005 |
|---|---|---|---|---|---|---|---|---|
| Amount Outstanding (Bil. Pounds) | ||||||||
| Mortgages | 537.4 | 546.1 | 550.1 | -8658 | -12663 | 549.3 | 542.6 | 521.1 |
| Credit Cards | 33.6 | 32.5 | 29.4 | 1075 | 4160 | 31.7 | 31.2 | 33.4 |
| Overdrafts | 9.6 | 9.7 | 10.1 | -0.1 | -0.4 | 9.7 | 9.8 | 9.9 |
| Structured Personal Loans | 66.0 | 66.3 | 66.2 | -0.3 | -0.2 | 67.0 | 66.3 | 64.0 |
| Mortgage Approvals | ||||||||
| Number (Thousands) | 21.1 | 22.2 | 58.6 | -5.2 | -64.0 | 686.6 | 827.1 | 753.7 |
| Value (Bil. Pounds) | 2.8 | 3.1 | 0.9 | -8.8 | -69.1 | 105.7 | 115.7 | 97.3 |
by Robert Brusca September 23, 2008
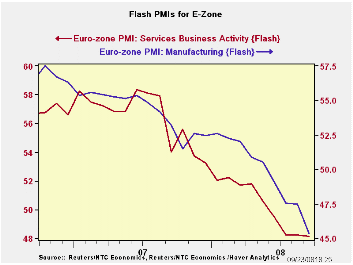
Surveys show that both the MFG and services PMI’s slipped in September. But the MFG PMI fell harder. Still, over this relatively short horizon (since January 2006) this is the weakest reading on record for services. For MFG it is the weakest reading on this horizon as well.
Taking the MFG reading back to 1997 it stands in the bottom 13% of its range. That is a higher relative position to be sure but still quite weak and not much source of solace.
The PMIs confirm that economic activity in Europe continues to slip. The most recent month’s orders series for EMU (June) showed a rise, but that was from the volatile transportation sector. Excluding transportation, orders were still falling in June. The more topical PMI survey data give a peek into September and we can see that slippage has continued apace right up to date. It is for their relatively greater timeliness that these surveys on MFG and services are so prized.
| FLASH Readings | ||||
|---|---|---|---|---|
| Markit PMIs for the Euro Area 15 | MFG | Services | ||
| Sep-08 | 45.34 | 48.15 | ||
| Aug-08 | 47.55 | 48.46 | ||
| Jul-08 | 47.38 | 48.32 | ||
| Jun-08 | 49.16 | 49.13 | ||
| Averages | ||||
| 3-Mo | 48.03 | 48.21 | ||
| 6-Mo | 49.58 | 49.41 | ||
| 12-Mo | 51.06 | 51.24 | ||
| 33-Mo Range | ||||
| High | 57.61 | 61.21 | ||
| Low | 45.34 | 48.15 | ||
| % Range | 0.0% | 0.0% | ||

Tom Moeller
AuthorMore in Author Profile »Prior to joining Haver Analytics in 2000, Mr. Moeller worked as the Economist at Chancellor Capital Management from 1985 to 1999. There, he developed comprehensive economic forecasts and interpreted economic data for equity and fixed income portfolio managers. Also at Chancellor, Mr. Moeller worked as an equity analyst and was responsible for researching and rating companies in the economically sensitive automobile and housing industries for investment in Chancellor’s equity portfolio. Prior to joining Chancellor, Mr. Moeller was an Economist at Citibank from 1979 to 1984. He also analyzed pricing behavior in the metals industry for the Council on Wage and Price Stability in Washington, D.C. In 1999, Mr. Moeller received the award for most accurate forecast from the Forecasters' Club of New York. From 1990 to 1992 he was President of the New York Association for Business Economists. Mr. Moeller earned an M.B.A. in Finance from Fordham University, where he graduated in 1987. He holds a Bachelor of Arts in Economics from George Washington University.
More Economy in Brief


