 Global| Oct 21 2008
U.S. Gasoline Prices Below $3.00
by:Tom Moeller
|in:Economy in Brief
Summary
For the first time since February of this year, the retail price for a gallon of regular gasoline fell below $3.00 per gallon. At $2.91, according to the U.S. Department of Energy survey, the price was the lowest since October of [...]
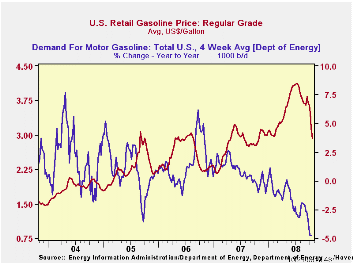
For the first time since February of this year, the retail price for a gallon of regular gasoline fell below $3.00 per gallon. At $2.91, according to the U.S. Department of Energy survey, the price was the lowest since October of 2007. The latest decline was accompanied by a drop in the average price for all grades of gasoline to $2.97 per gallon.
The spot market price for a gallon of regular gasoline during the last two days reversed some of its earlier weakness and rose to $1.92 after touching $1.78 last Thursday. In futures trading the November contract closed at $1.72 per gallon.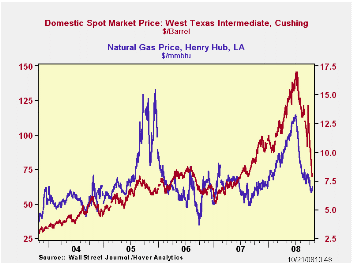
Weekly gasoline prices can be found in Haver's WEEKLY database. Daily prices are in the DAILY database.
According to the U.S. Department of Energy, the demand for gasoline fell 4.8% during the last four weeks versus the same four weeks last year. The y/y decline was the largest since late 1995.
These DOE figures are available in Haver's OILWKLY database.
The price for a barrel of West Texas Intermediate crude oil fell sharply last week to an average $75.21 per barrel, down by nearly one half from the high in July of $145.66. In futures trading, the two-month price for crude oil fell yesterday to $74.39 per barrel.
Last week prices for natural gas fell to their lowest level since August of last year. At an average $6.67 per mmbtu prices were down 6.6% year-to-year. The decline stabilized yesterday and prices rose to $6.99 per mmbtu. The high for natural gas prices was in early-July at $13.19/mmbtu.
| Weekly Prices | 10/20/08 | 10/13/08 | Y/Y | 2007 | 2006 | 2005 |
|---|---|---|---|---|---|---|
| Retail Regular Gasoline ($ per Gallon) | 2.91 | 3.15 | 3.2% | 2.80 | 2.57 | 2.27 |
| Light Sweet Crude Oil, WTI ($ per bbl.) | 75.21 | 86.23 | -14.8% | 72.25 | 66.12 | 56.60 |
by Tom Moeller October 21, 2008
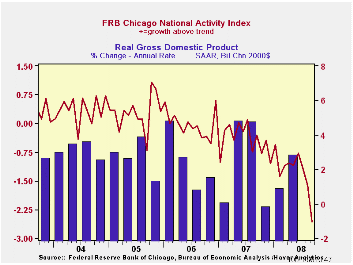
The National Activity Index (CFNAI) from the Chicago Federal Reserve Bank for September moved deeper into recession territory. The reading of -2.57 was the lowest since early during the 1981-82 recession.The current index level was then associated with -6.4% (AR) growth in real GDP during 1Q 1982.
The three-month moving average of the index also fell to -1.78 from -1.18 during August. The latest was its lowest since the last recession, early in 1991.
An index level at or below -0.70 typically has indicated negative U.S. economic growth. A zero value of the CFNAI indicates that the economy is expanding at its historical trend rate of growth of roughly 3%. During the last twenty years there has been a 68% correlation between the level of the CFNAI and q/q growth in real GDP.
The complete CFNAI report is available here and the historical data are available in Haver's SURVEYS database.
The production and income categories made the largest negative contribution to the total index's decline during September, though each of the component categories added a negative influence.
Inflationary pressure also was indicated to be low for the coming year with price index at it's lowest since 1990.
The CFNAI is a weighted average of 85 indicators of economic activity. The indicators reflect activity in the following categories: production & income, the labor market, personal consumption & housing, manufacturing & trade sales, and inventories & orders.
In a separate survey, the Chicago Fed indicated that its Midwest manufacturing index fell. The August index level reversed its recent improvement and fell to the lowest level since 2003. A decline in the auto sector component of the series led the weakness.
Revisiting Useful Approaches to Data-Rich Macroeconomic Forecasting from the Federal Reserve Bank of New York is available here.
| Chicago Fed | September | August | September '07 | 2007 | 2006 | 2005 |
|---|---|---|---|---|---|---|
| CFNAI | -2.57 | -1.61 | -0.30 | -0.43 | -0.03 | 0.27 |
| 3-Month Average | -1.78 | -1.18 | -0.32 | -- | -- | -- |
by Tom Moeller October 21, 2008
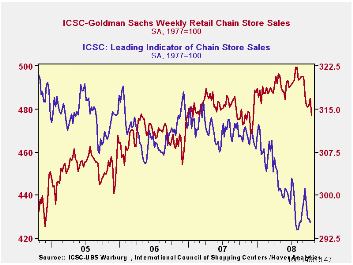
The ICSC-Goldman Sachs retail chain-store sales index is constructed using the same-store sales (stores open for one year) reported by 78 stores of seven retailers: Dayton Hudson, Federated, Kmart, May, J.C. Penney, Sears and Wal-Mart.
The leading indicator of chain store sales from ICSC-Goldman Sachs fell 0.2% (-4.8% y/y).The chain store sales figures are available in Haver's SURVEYW database.
| ICSC-UBS (SA, 1977=100) | 10/18/08 | 10/11/08 | Y/Y | 2007 | 2006 | 2005 |
|---|---|---|---|---|---|---|
| Total Weekly Chain Store Sales | 477.0 | 484.7 | 0.9% | 2.8% | 3.3% | 3.6% |
by Louise Curley October 21, 2008
The Confederation of Business Industry (CBI) released the results of its latest surveys of industrial trends. The quarterly survey gathers the opinions of manufacturers on a number of trends--the general business outlook, trends in their own output, orders, including foreign, capital spending, employment, prices and inventories. The monthly survey updates the opinions on trends in orders, inventories, prices and output--past and expected.
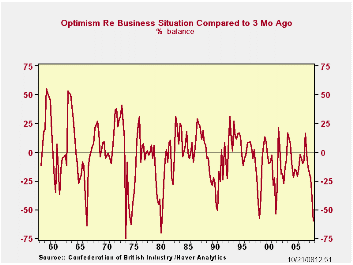
The latest quarterly survey shows that only 4% of the respondents were more optimistic about the general business situation than they had been in the previous survey, while 64% were more pessimistic, resulting in a -60 for the quarter. This was the most pessimistic reading of business confidence measure since the third quarter of 1980 when the excess of pessimists was 70%. The first chart shows the history of the CBI's confidence measure.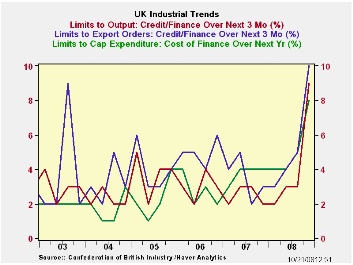
Most of the components of the survey showed low points not seen for some time. For example, 31% more of the respondents expected output over the next three months to be lower than those expecting it to be higher. It is necessary to go back to the fourth quarter of 1980 to find as many pessimists on the outlook. A few of the components are shown in the table below together with the date when a comparable figure occurred.
Ian McCafferty, Chief Economic Adviser of CBI remarked that ".....the sharp falls in orders and output show that the slowdown in the UK economy is now spreading to sectors previously resilient to the weakness in the banking and housing sectors. It is also of serious concern that constraints on capital now appear to be affecting manufacturers, in a way that had not been the case earlier." Indeed, there were spikes in the current quarter in the percentage of respondents who said credit or finance might be a factor in their negative appraisal of output, orders and capital spending, as can be seen in the second chart.
| UNITED KINGDOM CBI INDUSTRIAL TRENDS SURVEY | Q4 08 | Q3 08 | Q2 08 | Q1 08 | PRE- VIOUS | DATE |
|---|---|---|---|---|---|---|
| Output over next 3 months | -31 | -7 | 0 | 8 | -31 | 1980:4 |
| Capital Spending Buildings | -44 | -24 | -21 | -21 | -49 | 1996:4 |
| Capital Spending Plant & Equipment | -38 | -24 | -18 | -12 | -46 | 1980:4 |
| Domestic Orders | -42 | -21 | -9 | -3 | -42 | 1991:1 |
| Export Orders | -21 | -8 | 5 | 0 | -34 | 2001:4 |

Tom Moeller
AuthorMore in Author Profile »Prior to joining Haver Analytics in 2000, Mr. Moeller worked as the Economist at Chancellor Capital Management from 1985 to 1999. There, he developed comprehensive economic forecasts and interpreted economic data for equity and fixed income portfolio managers. Also at Chancellor, Mr. Moeller worked as an equity analyst and was responsible for researching and rating companies in the economically sensitive automobile and housing industries for investment in Chancellor’s equity portfolio. Prior to joining Chancellor, Mr. Moeller was an Economist at Citibank from 1979 to 1984. He also analyzed pricing behavior in the metals industry for the Council on Wage and Price Stability in Washington, D.C. In 1999, Mr. Moeller received the award for most accurate forecast from the Forecasters' Club of New York. From 1990 to 1992 he was President of the New York Association for Business Economists. Mr. Moeller earned an M.B.A. in Finance from Fordham University, where he graduated in 1987. He holds a Bachelor of Arts in Economics from George Washington University.
More Economy in Brief


