 Global| Jun 12 2009
U.S. Flow of Funds Indicate Further Shrinkage of Balance Sheets
by:Tom Moeller
|in:Economy in Brief
Summary
Since the peak in 2Q 2007, the net worth of the U.S. household & nonprofit sectors' has fallen by $13.8 trillion, or by nearly one-quarter. The decline to its lowest level since 2004 was led by the rapid shrinkage in asset values, [...]
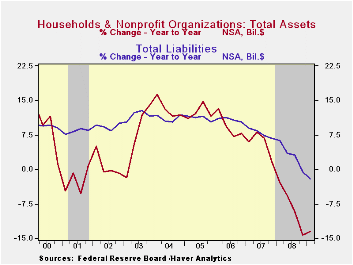
Since the peak in 2Q 2007, the net worth of the U.S. household & nonprofit sectors' has fallen by $13.8 trillion, or by nearly one-quarter. The decline to its lowest level since 2004 was led by the rapid shrinkage in asset values, namely of stocks and real estate. Over just the last four quarters alone, the decline totaled $9.8 trillion. Over that period, the value of the household sector's financial assets fell by $7.9 trillion as the value of equity market shares fell by $3.3 trillion, or by 39.1% y/y, and mutual fund share values also fell by $1.3 trillion, or 28.4%. In addition, pension fund reserves were hit by $2.78 trillion during the year or by 21.2%. Tangible asset values suffered somewhat less than financial values but they still were down sharply. Over the last year, the value of tangibles overall dropped $2.2 trillion (-8.3%) as the reduction in real estate values totaled $2.3 trillion or 10.3%.
Accompanying the decline in the household sector's asset
values was a reining in of liabilities. Total credit market liabilities
of the household sector rose just 4.4% during the last four quarters,
the weakest advance since 1954 (no typo). And all sectors pulled back
their borrowing -- except the Federal government whose liabilities grew
a record 28.3%. Non-government domestic liabilities retreated as the
recession generated further deleveraging. These liabilities fell for
the second quarter and were up a record slow 1.2% year-to-year. Credit
market debt owed by the household sector dropped sharply for the second
straight quarter (-0.6% y/y). After two quarters of breathtaking
decline, mortgage borrowing inched up 1.6% (-1.0% y/y). Consumers also
were of a mind to reduce credit liabilities which they did by a record
$75.3 billion (-0.4% y/y). With the third decline in the last four
quarters, the value of bank loans was up just 1.9% y/y, the least since
2005.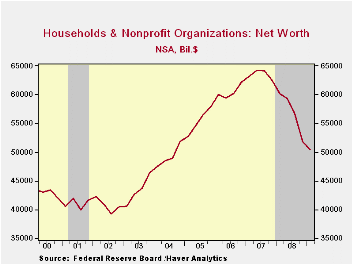
Credit market debt owed by the financial sector contracted and reversed roughly one-third of a 4Q rise. Year-to-year growth of 3.7% was down from a peak of 13.4% back in 2007. Liabilities of commercial banks rose 31.4% y/y but savings institutions liabilities fell for the fourth straight quarter (-25.3% y/y).
The liabilities of the foreign sector increased for the first quarter in the last three but year-to-year growth was a negative 9.0%.
Credit Quantity and Credit Quality: Bank Competition and Capital Accumulation from the Federal Reserve Bank of New York can be found here.
| Flow of Funds (Y/Y % Chg.) | % of Total | 1Q '09 | 4Q '08 | 2008 | 2007 | 2006 |
|---|---|---|---|---|---|---|
| Total Credit Market Debt Outstanding | -- | 4.4 | 5.2 | 5.2 | 10.1 | 9.9 |
| Federal Government | 11% | 28.3 | 24.2 | 24.2 | 4.9 | 3.9 |
| Households | 28% | -0.6 | 0.4 | 0.4 | 6.6 | 10.1 |
| Nonfinancial Corporate Business | 13% | 4.3 | 5.3 | 5.3 | 14.1 | 8.4 |
| Nonfarm, NonCorporate Business | 7% | 1.3 | 4.7 | 4.7 | 12.8 | 14.7 |
| Financial Sectors | 32% | 3.7 | 5.5 | 5.5 | 13.4 | 10.0 |
| Net Worth: Households & Nonprofit Organizations (Trillions) | -- | $50.376 | $51.706 | $51.706 | $62.191 | $62.206 |
| Tangible Assets: Households | -- | $24.221 | $24.782 | $24.782 | $27.102 | $28.288 |
| Financial Assets: Households | -- | $40.295 | $41.179 | $41.179 | $49.831 | $47.356 |
by Tom Moeller June 12, 2009
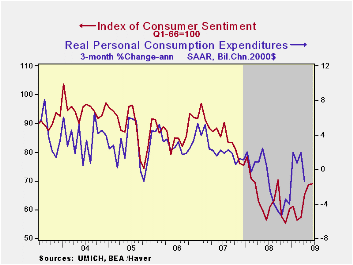
Good news seems better than bad news. That's an obvious statement, but it's behind the recent rise in the University of Michigan's early-June reading of consumer sentiment. At 69.0 the latest index level was roughly unchanged from May and it about matched Consensus expectations. The increase bodes well for the consumer spending outlook because during the last ten years, there has been a 61% correlation between the level of sentiment and the growth in real spending during the next five months.
The current economic conditions jumped ten percent from May to its highest level since last September. The reading for current personal finances just about made up the May decline. however, it was the jump in the reading of current conditions for buying large household goods to the highest level since March of last year that powered the increase. Showing a huge increase was the reading of current conditions for buying a motor vehicle. Though conditions for buying a house slipped, the level remained up sharply from last year.
The expectations component of consumer sentiment slipped this
month from May but it remained near the highest level since early last
year. Expectations for personal finances rose with higher stock prices
but expected business conditions during the next year slipped. Expected
conditions during the next five years similarly slipped. Both of these
readings remained, however, from their lows of earlier this year.
Though unemployment was expected to decline over the next twelve
months, price inflation was expected to heat up. Interest rates were
expected to fall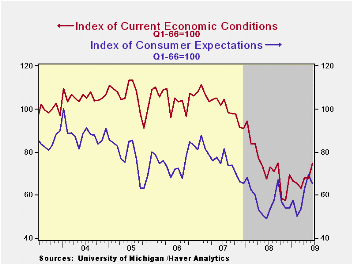
The opinion of government policy, which may eventually influence economic expectations, fell this month after having jumped through May. It remained near the highest level since 2002. A reduced 22% of respondents thought that a good job was being done by government while an increased 29% thought that a poor job was being done. Nevertheless, despite these monthly changes, the trend is still very much toward a favorable reading of policy actions.
Inflation expectations for the next year rose further to 3.8%. That compares to a low of 1.7% last December but remained down from a reading which was as high as 7.0% last May.
The University of Michigan survey data is not seasonally adjusted. The reading is based on telephone interviews with about 500 households at month-end; the mid-month results are based on about 300 interviews. The summary indexes are in Haver's USECON database with details in the proprietary UMSCA database.
Jobless Recovery Redux? from the Federal Reserve Bank of San Francisco can be found here.
| University of Michigan | Mid-June | May | April | June y/y | 2008 | 2007 | 2006 |
|---|---|---|---|---|---|---|---|
| Consumer Sentiment | 69.0 | 68.7 | 65.1 | 22.3% | 63.8 | 85.6 | 87.3 |
| Current Conditions | 74.5 | 67.7 | 68.3 | 10.2 | 73.7 | 101.2 | 105.1 |
| Expectations | 65.4 | 69.4 | 63.1 | 32.9 | 57.3 | 75.6 | 75.9 |
   |
by Tom Moeller June 12, 2009
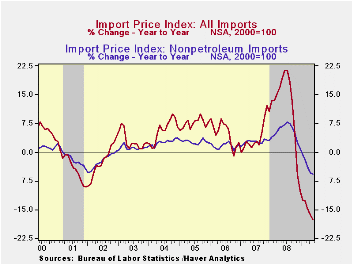
During May, U.S. import
prices moved higher again due to recent
increases in oil prices The expected 1.3% gain followed a similar 1.1%
rise during April and, since January, prices have risen by 2.9%.
Nevertheless, earlier declines in prices were severe with the start of
the global economic recession. Therefore the y/y change in import
prices remained a negative 17.6%.
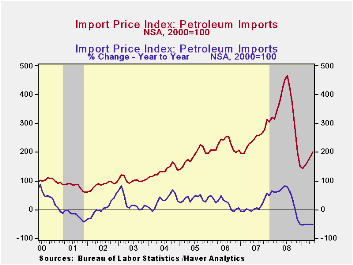
Higher petroleum prices have accelerated recent import price gains. The 8.3% increase last month was the fourth firm consecutive monthly rise and another strong gain is in store for this month. The price for a barrel of Brent Crude oil yesterday rose to $71.55. That's up nearly seven dollars, or ten percent, from the end of May. Crude oil prices have returned to where they were last October.
Non-oil import prices have firmed as
well, though nowhere near as dramatically as oil. The lower value of
the dollar as well as a firming U.S. economy undoubtedly were behind
the 0.2% price uptick in May which left prices roughly flat over the
last three months.
While not strong, by any means, the stability
compares to three-month price declines of 3.5% as recently as this past
January. (During the last ten years, there has been a negative 81%
correlation between the nominal trade-weighted exchange value of the US
dollar vs. major currencies and the y/y change in non-oil import
prices.)
During May, capital goods import prices were unchanged after a 0.1% uptick during April. On a three-month basis, prices fell 0.3% after the 0.9% decline during March. Excluding computers, capital goods prices were unchanged in May and three-month growth remained a low -0.4%. Prices of computers, peripherals & accessories rose 0.2% last month but they were down 0.3% during the last three months. Regardless of that firming, computer prices remained 6.4% lower than last year.
Prices for nonauto consumer goods were unchanged in
May, but here again there has been some firming versus earlier
declines. The three-month rate of change amounted to -0.2% which
compared to a -0.7% change as recently as January. Durable consumer
goods prices rose 0.4% over the last three months after a -1.7% decline
through January. Household goods and home entertainment equipment
prices have firmed considerably.
Moving the other way, declines in
apparel prices have offset some of that strength in durables.
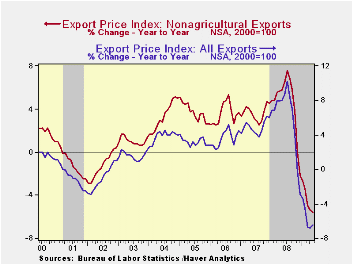
Total export prices have firmed and accompanied the gains in import prices. Last month they rose 0.6% led by a 3.6% (-14.7% y/y) rise in agricultural prices. Nonagricultural export prices also have firmed but not to the same degree. Last month they rose 0.3% and over three months they were up just 0.1% following a -6.0% decline as of the end of last year.
The import and export price series can be found in Haver's USECON database. Detailed figures are available in the USINT database.
Risks and Resolutions: The "Day After" for Financial Institutions - A Conference Summary from the Federal Reserve Bank of Chicago can be found here.
| Import/Export Prices (NSA, %) | May | April | Y/Y | 2008 | 2007 | 2006 |
|---|---|---|---|---|---|---|
| Import - All Commodities | 1.3 | 1.1 | -17.6 | 11.5 | 4.2 | 4.9 |
| Petroleum | 8.3 | 9.8 | -51.4 | 37.7 | 11.6 | 20.6 |
| Nonpetroleum | 0.2 | -0.2 | -5.8 | 5.3 | 2.7 | 1.7 |
| Export - All Commodities | 0.6 | 0.4 | -6.5 | 6.0 | 4.9 | 3.6 |
by Robert Brusca June 12, 2009
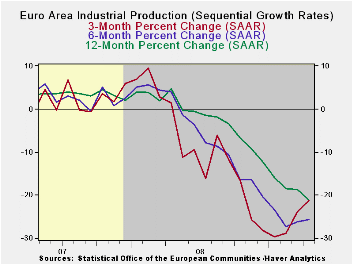
Industrial output fell again in April marking the 12th
straight month of decline in Yr/Yr output; industrial output has gone
12-months without a month to month gain as well (m/m output was flat in
August of 2008).
Declines spread across all major output categories in the
month. In terms of the sequential growth rates (3m compared to 6mo
compared to 12mo) there is improvement in train for intermediate and
capital goods but consumer goods output trends are getting
progressively worse. The overall trends show that after a worsening in
the growth rate at 6-months, the three-month growth rate has limited
its pace of decline to -18.9%.
Obviously the picture for EMU is still poor. Output is
declining on a broad front and still falling sharply on that broad
front. There are some signs that the output declines are abating. The
signs from the EMU index are the weakest. Strongest signs of a
turnaround come from the patterns in the large EMU economies.
| Euro Area MFG IP | ||||||||||
|---|---|---|---|---|---|---|---|---|---|---|
| Saar except m/m | Mo/Mo | Apr 09 |
Mar 09 |
Apr 09 |
Mar 09 |
Apr 09 |
Mar 09 |
|||
| Euro Area Detail | Apr 09 |
Mar 09 |
Feb 09 |
3mo | 3mo | 6mo | 6mo | 12mo | 12mo | Q-to- Date |
| MFG | -1.5% | -1.2% | -2.5% | -18.9% | -25.4% | -26.5% | -27.6% | -21.5% | -20.2% | -17.3% |
| Consumer | -0.9% | -0.5% | -1.8% | -11.9% | -10.3% | -9.6% | -9.4% | -8.6% | -7.3% | -10.3% |
| Consumer Durables | -0.8% | -1.2% | -3.6% | -20.2% | -24.6% | -25.9% | -26.8% | -22.2% | -20.9% | -- |
| Consumer Nondurables | -0.7% | -0.3% | -1.5% | -9.9% | -7.8% | -6.7% | -6.6% | -6.2% | -5.1% | -- |
| Intermediate | -1.7% | -1.8% | -2.5% | -21.6% | -22.8% | -32.5% | -34.1% | -26.6% | -25.3% | -20.4% |
| Capital | -2.7% | 0.0% | -3.1% | -21.0% | -34.6% | -32.6% | -32.8% | -26.3% | -22.3% | -20.5% |
| Main Euro Area Countries and UK IP in MFG | ||||||||||
| Mo/Mo | Apr-09 | Mar 09 |
Apr 09 |
Mar 09 |
Apr 09 |
Mar 09 |
||||
| MFG Only | Apr 09 |
Mar 09 |
Feb 09 |
3mo | 3mo | 6mo | 6mo | 12mo | 12mo | Q-to- Date |
| Germany: | -2.9% | 0.8% | -3.5% | -20.5% | -35.2% | -36.8% | -35.8% | -24.2% | -22.1% | -19.4% |
| France: IP excl Construction | -1.4% | -1.7% | -0.9% | -15.0% | -24.4% | -22.5% | -26.1% | -18.8% | -16.4% | -15.8% |
| Italy | 0.7% | -4.7% | -5.0% | -30.9% | -36.7% | -30.6% | -34.8% | -25.2% | -25.6% | -22.7% |
| Spain | 5.8% | -5.0% | 1.2% | 7.1% | -39.1% | -24.7% | -36.1% | -28.6% | -13.7% | 16.7% |
| UK: EU member | 0.2% | 0.2% | -0.2% | 0.9% | -12.2% | -15.2% | -18.2% | -12.7% | -13.1% | 1.8% |

Tom Moeller
AuthorMore in Author Profile »Prior to joining Haver Analytics in 2000, Mr. Moeller worked as the Economist at Chancellor Capital Management from 1985 to 1999. There, he developed comprehensive economic forecasts and interpreted economic data for equity and fixed income portfolio managers. Also at Chancellor, Mr. Moeller worked as an equity analyst and was responsible for researching and rating companies in the economically sensitive automobile and housing industries for investment in Chancellor’s equity portfolio. Prior to joining Chancellor, Mr. Moeller was an Economist at Citibank from 1979 to 1984. He also analyzed pricing behavior in the metals industry for the Council on Wage and Price Stability in Washington, D.C. In 1999, Mr. Moeller received the award for most accurate forecast from the Forecasters' Club of New York. From 1990 to 1992 he was President of the New York Association for Business Economists. Mr. Moeller earned an M.B.A. in Finance from Fordham University, where he graduated in 1987. He holds a Bachelor of Arts in Economics from George Washington University.
More Economy in Brief


