 Global| Mar 17 2009
U.S. Finished Goods PPI Rises Modestly; "Downstream" Pricing Remains Weak
by:Tom Moeller
|in:Economy in Brief
Summary
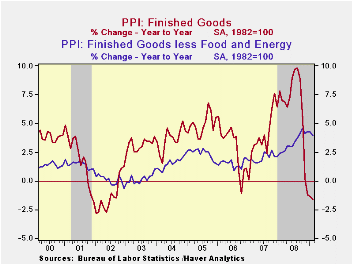
U.S. producer prices for finished goods increased a modest 0.1% last month. The slim gain offset last month's upside surprise of 0.8%, which was unrevised. Moreover, it contrasted with Consensus expectations for a 0.4% gain.Much of [...]
 U.S.
producer prices for finished goods increased a modest 0.1% last month.
The slim gain offset last month's upside surprise of 0.8%, which was
unrevised. Moreover, it contrasted with Consensus expectations for a
0.4% gain.
U.S.
producer prices for finished goods increased a modest 0.1% last month.
The slim gain offset last month's upside surprise of 0.8%, which was
unrevised. Moreover, it contrasted with Consensus expectations for a
0.4% gain.
Much of the reason for the latest moderation was a slimmer
0.2% rise in prices less food & energy which followed the
strong 0.4% January increase. A 0.1% has been expected. Prices of core
finished consumer goods rose 0.4% last month (4.1% y/y). Durable
consumer goods prices increased 0.2% (3.0% y/y) while core nondurable
goods prices increased another firm 0.5% (5.1% y/y). Finally, the gain
in monthly capital equipment prices eased to 0.1% after a 0.5% January
jump but the 3.7% increase y/y remained the strongest since 1991.· A
1.3% increase (-19.3% y/y) in finished energy prices moderated from the
3.7% rise during January. 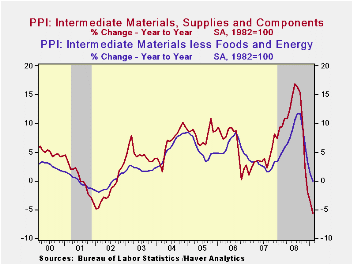 The rise in gasoline prices moderated to 8.7%
from a 15% spike in January (42.4% y/y) and home heating oil prices
reversed all of their January increase with a 7.2% decline (-46.4%
y/y). Natural gas prices fell 3.61% (-2.4% y/y).
The rise in gasoline prices moderated to 8.7%
from a 15% spike in January (42.4% y/y) and home heating oil prices
reversed all of their January increase with a 7.2% decline (-46.4%
y/y). Natural gas prices fell 3.61% (-2.4% y/y).
Prices for finished foods continued weak and they posted a 1.6% decline (+0.9% y/y), the third consecutive down month. The drop was led by lower meat (-3.8% y/y) and dairy product costs (-15.3% y/y).
Prices for intermediate goods continued downward and continued to hold promise for weaker finished goods prices. Intermediate goods prices fell 0.9% during February and are down 5.6% year-to-year, the weakest since 1949. Excluding food & energy, prices also were quite weak dropping 0.6%, the fifth consecutive monthly decline. The 0.1% y/y decline was the weakest comparison since 2002.
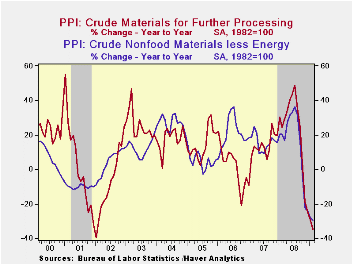 The crude materials PPI
fell with the economy's loss of momentum. The 4.5% decline in the total
was led by an 8.5% drop (-48.3% y/y) in energy prices. Crude food
prices continued lower by 3.9% (-19.5% y/y) after the brief 1.0% rise
during January. Less food & energy, January crude prices rose
by 1.5% on the strength of higher metals prices.
The crude materials PPI
fell with the economy's loss of momentum. The 4.5% decline in the total
was led by an 8.5% drop (-48.3% y/y) in energy prices. Crude food
prices continued lower by 3.9% (-19.5% y/y) after the brief 1.0% rise
during January. Less food & energy, January crude prices rose
by 1.5% on the strength of higher metals prices.
The Producer Price Index data is available in Haver's USECON database. More detailed data is in the PPI and in the PPIR databases.
Foreign Direct Investment, Productivity, and Country Growth: An Overview from the Federal Reserve Bank of St. Louis is available here.
| Producer Price Index (%) | February | January | Y/Y | 2008 | 2007 | 2006 |
|---|---|---|---|---|---|---|
| Finished Goods | 0.1 | 0.8 | -1.6 | 6.4 | 3.9 | 2.9 |
| Core | 0.2 | 0.4 | 3.9 | 3.4 | 2.0 | 1.5 |
| Intermediate Goods | -0.9 | -0.7 | -5.6 | 10.5 | 4.0 | 6.4 |
| Core | -0.6 | -1.1 | -0.1 | 7.6 | 2.8 | 6.0 |
| Crude Goods | -4.5 | -2.9 | -34.7 | 21.2 | 11.9 | 1.4 |
| Core | 1.5 | 0.1 | -29.4 | 15.0 | 15.6 | 20.8 |

Tom Moeller
AuthorMore in Author Profile »Prior to joining Haver Analytics in 2000, Mr. Moeller worked as the Economist at Chancellor Capital Management from 1985 to 1999. There, he developed comprehensive economic forecasts and interpreted economic data for equity and fixed income portfolio managers. Also at Chancellor, Mr. Moeller worked as an equity analyst and was responsible for researching and rating companies in the economically sensitive automobile and housing industries for investment in Chancellor’s equity portfolio. Prior to joining Chancellor, Mr. Moeller was an Economist at Citibank from 1979 to 1984. He also analyzed pricing behavior in the metals industry for the Council on Wage and Price Stability in Washington, D.C. In 1999, Mr. Moeller received the award for most accurate forecast from the Forecasters' Club of New York. From 1990 to 1992 he was President of the New York Association for Business Economists. Mr. Moeller earned an M.B.A. in Finance from Fordham University, where he graduated in 1987. He holds a Bachelor of Arts in Economics from George Washington University.
More Economy in Brief


