 Global| Sep 21 2017
U.S. Financial Accounts Show Larger Borrowing, Mainly by the Federal Government
Summary
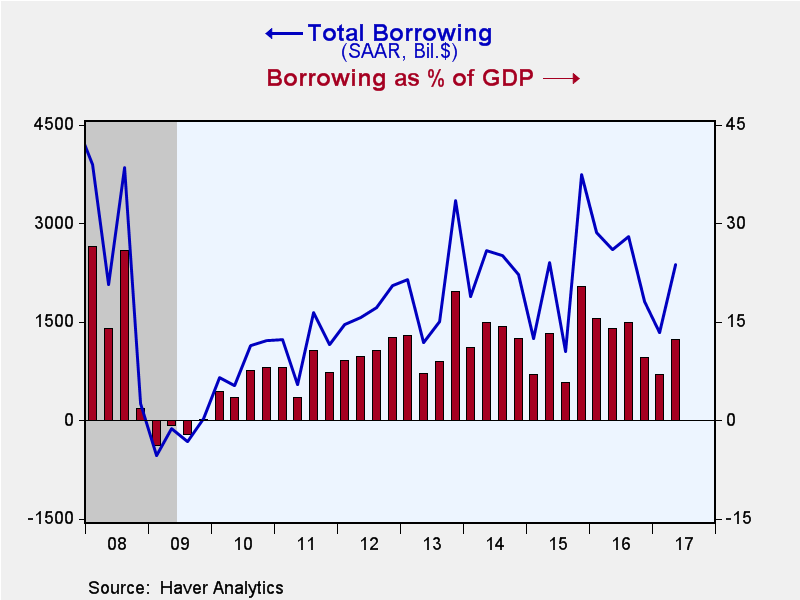
Borrowing in U.S. financial markets picked up in Q2 2017, according to the Federal Reserve's Financial Accounts data, which show debt issuance of $2,378 billion at a seasonally adjusted annual rate. This compares to $1,333 billion [...]
Borrowing in U.S. financial markets picked up in Q2 2017, according to the Federal Reserve's Financial Accounts data, which show debt issuance of $2,378 billion at a seasonally adjusted annual rate. This compares to $1,333 billion SAAR in Q1. The Q2 amount was 12.4% of GDP versus 7.0% in Q1, taking this ratio back to the general range of 10-15% has prevailed since 2012. For comparison, the ratio averaged almost 29% in the five years before the Great Recession and just under 20% over long stretches before then.
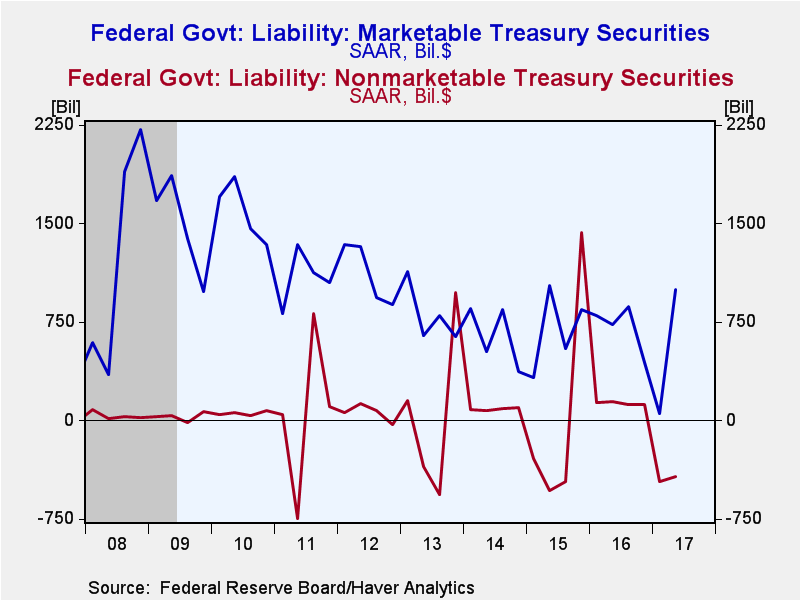
The federal government was again the main source of change in the credit markets, as it raised $578 billion SAAR in Q2, turning around from the net paydown of $414 billion in Q1. The latter unusual movement reflected a debt ceiling situation in March. In Q2, practices returned to a more normal pattern, and the Treasury raised $624 billion in Treasury bills and $383 billion in marketable coupon securities. However, nonmarketable debt continued to be liquidated, falling $423 billion, especially in the Treasury Savings Plan G Fund, a tax-deferred savings vehicle for federal employees, down $129 billion, and the defined-benefit pension plan, down $230 billion.
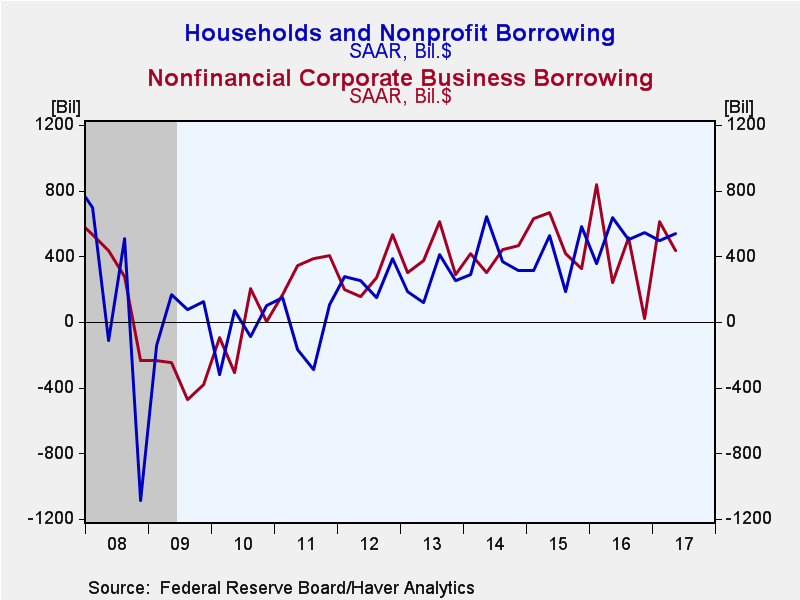
Households added debt in Q2 at a $542 billion annual rate, up from $495 billion in Q1. Home mortgage borrowing was $276 billion SAAR, versus the $331 billion pace in Q1. Consumer credit growth was fairly steady at $170 billion in Q2 compared with $191 billion in Q1. Including depository institution loans and "other" loans (some of these to nonprofit organizations and miscellaneous businesses and funds), total household borrowing amounted to 3.8% of disposable personal income in Q2, up from 3.5% in Q1. This ratio remains low, compared to the obviously much larger ratios just ahead of the Great Recession, but also compared to a range of 5-8% across long spans of years before then. So people continue to be conservative in their use of credit.
Corporate business borrowing moderated somewhat in Q2, $438 billion SAAR versus $612 billion in Q1. Their issuance of securities was $268 billion, down from $431 billion, and loans grew at a fairly steady $170 billion rate, very similar to Q1's $180 billion. Financial institutions increased their debt usage notably in Q2, $484 billion, up from $261 billion in Q1.
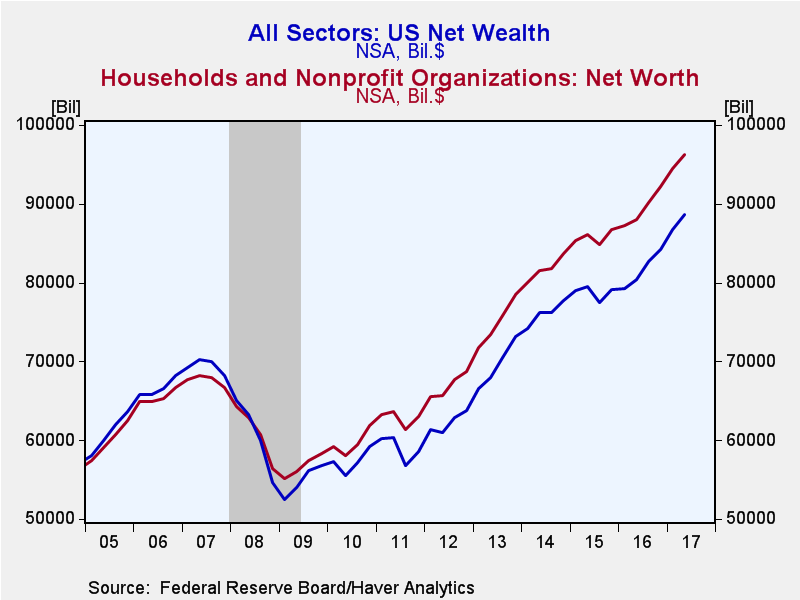
Press reports of these Financial Accounts highlight household balance sheets and net worth, and with a continuing rise in the stock market, they describe the latest quarter-end amount, $96.2 trillion, as yet another record (level, not seasonally adjusted). Holdings of corporate shares rose $783 billion (quarterly rate, not seasonally adjusted), similar to the Q1 increase of $812 billion. Homeowners' equity rose $395 billion, following a gain of $385 billion in Q1.
Net wealth of the total economy moved ahead $2.0 trillion in Q2 to $88.7 trillion from $86.7 trillion at end-Q1 (also levels, not seasonally adjusted). The total market value of domestic corporations rose to $34.3 trillion from $33.2 trillion. Net financial claims on the "rest of the world" remained steady at -$6.15 trillion versus -$6.11 trillion. The remainder of the net wealth measure consists of nonfinancial assets held by households, noncorporate business and governments; these totaled $60.6 trillion at end-Q2, up $931 billion from end-Q1.
The Financial Accounts data are in Haver's FFUNDS database. Associated information is compiled in the Integrated Macroeconomic Accounts produced jointly with the Bureau of Economic Analysis (BEA); these are carried in Haver's USNA database.
Carol Stone, CBE
AuthorMore in Author Profile »Carol Stone, CBE came to Haver Analytics in 2003 following more than 35 years as a financial market economist at major Wall Street financial institutions, most especially Merrill Lynch and Nomura Securities. She had broad experience in analysis and forecasting of flow-of-funds accounts, the federal budget and Federal Reserve operations. At Nomura Securities, among other duties, she developed various indicator forecasting tools and edited a daily global publication produced in London and New York for readers in Tokyo. At Haver Analytics, Carol was a member of the Research Department, aiding database managers with research and documentation efforts, as well as posting commentary on select economic reports. In addition, she conducted Ways-of-the-World, a blog on economic issues for an Episcopal-Church-affiliated website, The Geranium Farm. During her career, Carol served as an officer of the Money Marketeers and the Downtown Economists Club. She had a PhD from NYU's Stern School of Business. She lived in Brooklyn, New York, and had a weekend home on Long Island.


