 Global| Dec 15 2008
U.S. Factory Output Off AsRecession Worsens
by:Tom Moeller
|in:Economy in Brief
Summary
Industrial production fell 0.7% during November after a revised 1.5% rise (initially reported at 1.3%) during October. That earlier increase was lifted by recoveries from Hurricanes Gustav & Ike and an end to the strike at Boeing. [...]
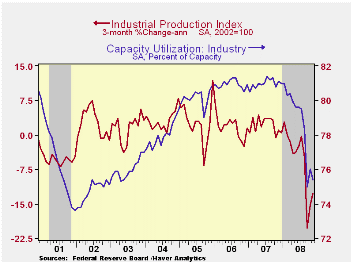
Industrial production fell 0.7% during November after a revised 1.5% rise (initially reported at 1.3%) during October. That earlier increase was lifted by recoveries from Hurricanes Gustav & Ike and an end to the strike at Boeing. Last month's decline about matched Consensus expectations.The -5.5% y/y change in industrial output was nearly sharpest drop since the recession of 1982.
The weakness in factory output was worse than the total IP
figure suggested. In fact a 1.4% decline in manufacturing production
was double that of the total and nearly the worst since 1982. Output of
consumer goods fell 0.7% and that pulled the y/y change to -3.8% as
production of motor vehicles & parts declined 2.8% (-21.4%
y/y). Outside of the auto sector the news was quite bad and production
fell 1.4% for a 6.3% y/y decline.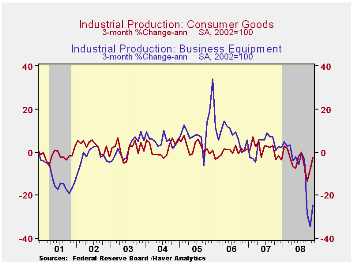
Industrial production in the high-tech sector is in steep recession. Output fell 1.9% during November, about as it did during the prior three months. The figure was pulled lower by a 1.1% (-2.9% y/y) shortfall in the output of computers & peripherals which was the sixth consecutive monthly drop.
Output declines extend well beyond autos and high-tech. Less those two sectors, production fell 1.4% last month for a y/y decline of 6.9%. Indeed, the industry detail further reflected widespread recession in the factory sector. Output of furniture & related products fell 2.9% last month for an 18.8% y/y decline, the largest y/y drop since the recession of 1975. Machinery production continued to reflect recession. The 2.3% (-8.8% y/y) was the third such consecutive drop. Output of electrical equipment production again joined the recession show and fell 2.2% (-5.0% y/y). Apparel output in the "recession-resistant" nondurables sector slipped 0.3% after much heftier declines during the prior two months but it is down just 4.0% y/y. Production of chemicals reversed much of an October increase and fell 3.6% (-8.7% y/y).
Utility output surged 1.6% (-0.3% y/y) with colder temperatures.
Capacity utilization fell to 75.4% after its brief October recovery. It was close to its lowest level since 2003. Utilization in the factory sector of 72.2% also was near the lowest since 2003. Capacity in the factory sector increased a firm 1.7% y/y).
The Financial Tsunami and the Federal Reserve is today's speech delivered by Philadelphia Fed President Charles I. Plosser and it can be found here.
| INDUSTRIAL PRODUCTION (SA, %) | November | October | Y/Y | 2007 | 2006 | 2005 |
|---|---|---|---|---|---|---|
| Total Output | -0.7 | 1.5 | -5.5 | 1.7 | 2.2 | 3.3 |
| Manufacturing | -1.4 | 0.7 | -7.3 | 1.8 | 2.8 | 4.2 |
| Consumer Goods | -0.7 | 1.6 | -3.8 | 1.7 | 0.3 | 2.8 |
| Business Equipment | 3.3 | -2.6 | -7.4 | 3.3 | 10.4 | 7.3 |
| Construction Supplies | -3.3 | -1.4 | -9.7 | -2.5 | 2.2 | 4.5 |
| Utilities | 1.6 | 0.7 | -0.3 | 3.3 | -0.6 | 2.1 |
| Capacity Utilization | 75.4 | 76.0 | 81.1 (Nov.'07) | 81.0 | 80.9 | 80.2 |
by Tom Moeller December 15, 2008
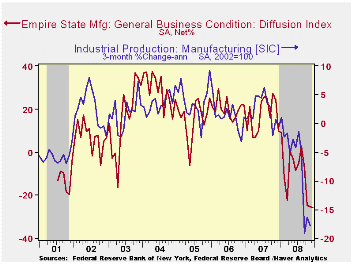
The Empire State Index of manufacturing actor activity for December, reported by the Federal Reserve Bank of New York, remained as negative as it was during the prior month. At -25.73 the index was the lowest in the series' short eight year history. A reading of -27 had been the Consensus expectation.
The figure is a diffusion index. Since the series' inception
in 2001 there has been a 58% correlation between its level and the
three-month change in U.S. factory sector industrial production.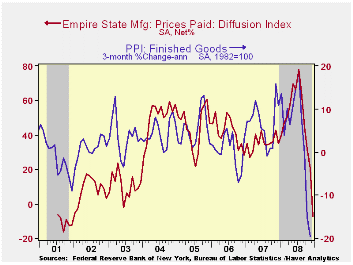
The index of pricing pressure also fell to an eight year low of -7.45, down over twenty five points from November. That was the lowest level since December 2001. Since inception in 2001, there has been an 81% correlation between the index of prices paid and the three-month change in the core intermediate materials PPI.
The indexes for new orders, shipments and unfilled orders all remained about as negative as during November.
The employment index improved just slightly m/m but remained near its lowest level since late 2001, negative for the sixth consecutive month. In the history of the NY employment index, there has been an 86% correlation between it and the three-month growth in overall factory sector employment.
Like the Philadelphia Fed Index of General Business Conditions, the Empire State Business Conditions Index reflects answers to an independent survey question; it is not a weighted combination of the components.
The Empire State index of expected business conditions in six months improved slightly to 19.48 from 13.02. It was still close to its lowest since the recession of 2001. The subseries for shipments improved but employment and new orders remained low. The pricing index collapsed to the lowest level since 2001.
The Empire State Manufacturing Survey is a monthly survey of manufacturers in New York State conducted by the Federal Reserve Bank of New York. Participants from across the state in a variety of industries respond to a questionnaire and report the change in a variety of indicators from the previous month. Respondents also state the likely direction of these same indicators six months ahead.
For more on the Empire State Manufacturing Survey, including methodologies and the latest report, click here.
| Empire State Manufacturing Survey | December | November | December '07 | 2008 | 2007 | 2006 |
|---|---|---|---|---|---|---|
| General Business Conditions (diffusion index, %) | -25.76 | -25.43 | 9.89 | -10.13 | 17.23 | 20.24 |
| Prices Paid | -7.45 | 20.48 | 35.00 | 46.99 | 35.64 | 41.88 |
by Tom Moeller December 15, 2008
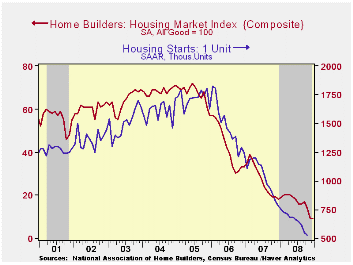
The National Association of Home Builders' (NAHB) indicated that its December Composite Housing Market Index remained stable m/m at a reading of 9. The latest level was the lowest in the series' history which extends back to 1984 and it was down by 90% from the high during 2005.
During the last twenty years there has been an 83% correlation
between the y/y change in the Composite Index and the change in single
family housing starts.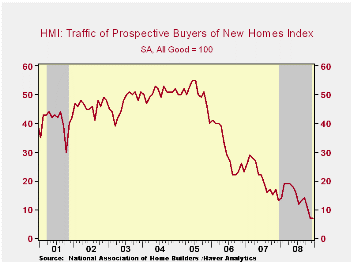
The index for single-family detached homes dipped slightly m/m to a new series' low while builders' view of single-family home sales during the next six months also fell to the series' low.
Traffic of prospective home buyers held steady m/m at the series' low.
Except for a modest uptick in the West, the builders' index in the country's regions continued to decline or held steady at the record low level.
The NAHB index is a diffusion index based on a survey of builders. Readings above 50 signal that more builders view conditions good than poor.
Visit the National Association of Home Builders.
The Great Recapitalization from the Federal Reserve Bank of St. Louis can be found here.
| Nat'l Association of Home Builders | December | November | December '07 | 2008 | 2007 | 2006 |
|---|---|---|---|---|---|---|
| Composite Housing Market Index | 9 | 9 | 18 | 16 | 27 | 42 |
by Louise Curley December 15, 2008
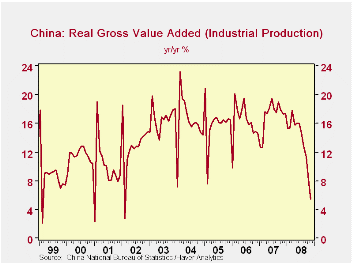
Chinese industrial production increased 5.4% in November, the smallest increase since 2002. Growth in industrial production declined intermittently for a year after reaching a monthly year to year peak of 19.5% in June, 2007, but in the last five months it has been in a free fall, from 16.0% to 5.4%. The year to year changes in the growth of industrial production are shown in the first chart.
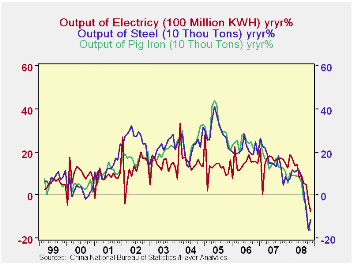
Some of the components of industrial production are showing declines of more than a month for first time. Production of electricity has been down for the last two months, that of steel for the last three months and the of pig iron for the last four months as shown in the second chart.
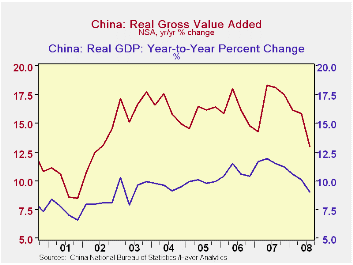
China's National Bureau of Statistics measures industrial production in terms of gross value added in 1990 prices. It is therefore a much broader measure than the indexes of industrial production of most other countries and is a good proxy for Real Gross Domestic Product. The similarity between the trends of the GDP and GVA , shown in the third chart, is apparent. The slow down in industrial production growth in October and November, suggest that the growth in the fourth quarter of GDP will be well below the 9% of the third quarter.
| CHINA
INDUSTRIAL PRODUCTION (GROSS VALUE ADDED) Y/Y PERCENT CHANGE |
Nov 08 | Oct 08 | Sep 08 | Aug 08 | Jul 08 | Jun 08 |
|---|---|---|---|---|---|---|
| Industrial Production | 5.4 | 8.2 | 11.4 | 12.8 | 14.7 | 16.0 |
| Output of Selected Products | ||||||
| Electricity | -7.79 | -3.04 | 4.80 | 5.71 | 9.59 | 8.06 |
| Steel | -11.34 | -16.36 | -7.25 | 2.37 | 8.81 | 11.45 |
| Pig Iron | -16.00 | -16.36 | -4.97 | -1.86 | -5.80 | -8.38 |
by Robert Brusca December 15, 2008
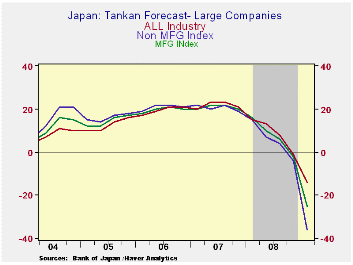
Japan’s Tankan for 2008 Q4 shows dramatic weakening. The
headline pace for large enterprises in manufacturing has dropped to -24
from -3 in 2008-Q4. Non MFG has turned negative to -9 in Q4 from +1 in
Q3. The all industries index is at -16 in 2008-Q4 down from flat in
2008-Q3. Of the main sectors, Construction. Real estate, Wholesaling,
Retailing, Transportation, Services for businesses, Personal services
and Restaurants and hotels all are on their weakest respective readings
since 2003-Q3 except Construction. That sector reading lies in the
bottom quarter of its range.
Even construction is weak as its average has been a reading of
-3.0 while its actual reading in 2008 Q4 is -10. Manufacturing’s
average score has been -13.5 and that is now at -24.0.
The manufacturing outlook has also deteriorated. The Q1
outlook if for a reading of -36 compared to an outlook for -4 for
2008-Q4. Similarly for Nonmanufacturing the outlook has slipped to -14
in 2009-Q1 from what was -1 for 2008-Q4.
The outlook and current assessments for small and medium-sized
firms is just as bad or worse. In Japan the large enterprise survey is
the bellwether.
| Tankan Results Large Enterprises | |||||||
|---|---|---|---|---|---|---|---|
| Readings | Averages | PERCENTILES | |||||
| Q4-08 | Q3-08 | Q2-08 | Q1-08 | 1-Y Avg | Since Q3'03 | Since Q1'04 | |
| MFG | -24.0 | -3.0 | 5.0 | 11.0 | -13.5 | 16.3 | 0.0% |
| Nonmanufacturing | -9.0 | 1.0 | 10.0 | 12.0 | -4.0 | 13.8 | 0.0% |
| Total Industry | -16.0 | 0.0 | 7.0 | 12.0 | -8.0 | 15.1 | 0.0% |
| Construction | -10.0 | -7.0 | -1.0 | -9.0 | -8.5 | -3.8 | 22.2% |
| Real Estate | -7.0 | 5.0 | 22.0 | 21.0 | -1.0 | 29.2 | 0.0% |
| Wholesale | -7.0 | 11.0 | 12.0 | 14.0 | 2.0 | 17.5 | 0.0% |
| Retail | -18.0 | -5.0 | 0.0 | 0.0 | -11.5 | 4.5 | 0.0% |
| Transportation | -7.0 | 6.0 | 16.0 | 17.0 | -0.5 | 13.9 | 0.0% |
| Services for Business | -1.0 | 4.0 | 20.0 | 22.0 | 1.5 | 22.2 | 0.0% |
| Personal Services | -11.0 | 6.0 | 10.0 | 13.0 | -2.5 | 9.6 | 0.0% |
| Restaurants & Hotels | -32.0 | -13.0 | -14.0 | -3.0 | -22.5 | 4.5 | 0.0% |
| Forecast | |||||||
| Q1-09 | Q4-08 | Q3-08 | Q2-08 | 1-Y Avg | Since Q3'03 | Since Q1'04 | |
| Manufacturing - Outlook | -36.0 | -4.0 | 4.0 | 7.0 | -7.3 | 13.6 | 0.0% |
| Nonmanufacturing - Outlook | -14.0 | -1.0 | 8.0 | 13.0 | 1.5 | 13.2 | 0.0% |
| All Industry-Outlook | -25.0 | -2.0 | 6.0 | 10.0 | -2.8 | 13.3 | 0.0% |

Tom Moeller
AuthorMore in Author Profile »Prior to joining Haver Analytics in 2000, Mr. Moeller worked as the Economist at Chancellor Capital Management from 1985 to 1999. There, he developed comprehensive economic forecasts and interpreted economic data for equity and fixed income portfolio managers. Also at Chancellor, Mr. Moeller worked as an equity analyst and was responsible for researching and rating companies in the economically sensitive automobile and housing industries for investment in Chancellor’s equity portfolio. Prior to joining Chancellor, Mr. Moeller was an Economist at Citibank from 1979 to 1984. He also analyzed pricing behavior in the metals industry for the Council on Wage and Price Stability in Washington, D.C. In 1999, Mr. Moeller received the award for most accurate forecast from the Forecasters' Club of New York. From 1990 to 1992 he was President of the New York Association for Business Economists. Mr. Moeller earned an M.B.A. in Finance from Fordham University, where he graduated in 1987. He holds a Bachelor of Arts in Economics from George Washington University.
More Economy in Brief


