 Global| Mar 06 2008
U.S. Factory Inventory Gain Strong, Orders Reverse December Rise
by:Tom Moeller
|in:Economy in Brief
Summary
Factory inventories surged 1.3% in January and posted the strongest m/m increase since early 2005. It followed an upwardly revised 0.9% December increase. Together the gains lifted the three month annualized rate of increase to 12.0%, [...]
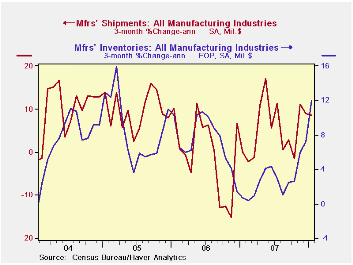
Factory inventories surged 1.3% in January and posted the strongest m/m increase since early 2005. It followed an upwardly revised 0.9% December increase. Together the gains lifted the three month annualized rate of increase to 12.0%, up sharply from last year's lows which were at or below 1.0% through the Summer.
Excluding the volatile transportation sector where the aircraft industry can have an outsized effect on the total figures, the story of accelerated inventory accumulation isn't much different. Inventories rose the same 1.3% in January, the December rise was revised up, and the three month rate of accumulation was 9.6%, up from slight decumulation early last year. Inventories in the civilian aircraft industry rose 3.7% during January and the three month rate of gain was 51.3%.
Total factory orders fell 2.5% during January, pulled lower by a 30.4% m/m decline in orders for civilian aircraft (+86.7% y/y). Less that decline and less the transportation sector altogether, orders fell a slight 0.4% after a 0.6% December gain. The three month rate of increase at 6.9% was down from the double digit rates of increase seen last year. January orders for durable goods fell 5.1%, about the same as the advance report of a 5.3% decline.
Factory shipments surged 1.1%, again influenced by a strong aircraft industry where shipments rose 11.7% (19.1% y/y). Excluding the transportation sector shipments rose 0.8% and the three month rate of growth of 9.2% was down by half from last year's peak rates of gain.
Overall unfilled orders rose 0.7% in January and the three month rate of increase was a hefty 18.6%. Shipments of civilian aircraft & parts still can't keep pace with orders, therefore backlogs rose 1.4% after a 4.0% surge in December (45.0% y/y). Excluding the transportation sector altogether unfilled orders rose a lesser 0.4% during January and the three month average growth rate was a still firm 9.2% (AR).
Macroeconomic Interdependence and the International Role of the Dollar from the Federal Reserve Bank of New York is available here .
| Factory Survey (NAICS, %) | January | December | Y/Y | 2007 | 2006 | 2005 |
|---|---|---|---|---|---|---|
| Inventories | 1.3 | 0.9 | 5.0 | 3.7 | 6.4 | 8.9 |
| Excluding Transportation | 1.3 | 0.5 | 4.0 | 2.5 | 7.1 | 8.0 |
| New Orders | -2.5 | 2.0 | 7.7 | 1.4 | 5.1 | 11.6 |
| Excluding Transportation | -0.4 | 0.6 | 8.0 | 1.2 | 5.4 | 11.5 |
| Shipments | 1.1 | -0.4 | 7.1 | 1.1 | 4.3 | 10.3 |
| Excluding Transportation | 0.8 | -0.2 | 8.1 | 1.3 | 5.0 | 11.4 |
| Unfilled Orders | 0.7 | 2.5 | 18.3 | 18.1 | 20.0 | 15.0 |
| Excluding Transportation | 0.4 | 1.3 | 8.6 | 9.1 | 14.1 | 8.4 |
by Tom Moeller March 6, 2008
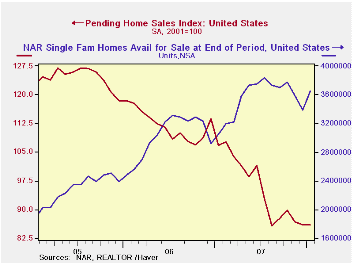
The National Association of Realtors reported that the January level of pending sales of existing homes was unchanged from December. The reading contrasted slightly with Consensus expectations for a modest decline. The latest level also was unchanged from last year's low reached in August.
These figures are analogous to the new home sales data from the Commerce Dept. They measure existing home sales when the sales contract is signed, not at the time the sale is closed.
In contrast to the stability in overall sales, pending home sales in the Northeast continued to fall. The 4.1% m/m January decline was the sixth in the last seven months and sales were down 40.1% from the monthly peak early in 2005. Sales in the South also were quite weak in January and fell 6.1% m/m, the fourth down month in a row. Sales were off 35.5% from the 2005 peak.
Sales in the Midwest recently have shown some stability. They rose 0.6% in January and were up 7.4% from the low last August. Nevertheless, sales were one third lower than the 2004 peak. Out West sales recovered in January. The 13.0% rise was first m/m gain on record but sales were still 44.6% below the late 2005 peak.
The Realtors also indicated in an earlier report that the number of homes on the market and available for sale rose 5.5% (18.4% y/y) in January.
The pending home sales data are available in Haver's PREALTOR database and the number of homes on the market are in the REALTOR database.
| Pending Home Sales (2001=100) | January | December | Y/Y | 2007 | 2006 | 2005 |
|---|---|---|---|---|---|---|
| Total | 85.9 | 85.9 | -19.6% | 95.7 | 112.1 | 124.3 |
| Northeast | 69.6 | 72.6 | -28.0 | 85.6 | 98.5 | 108.3 |
| Midwest | 85.2 | 84.7 | -13.3 | 89.6 | 102.0 | 116.4 |
| South | 89.5 | 95.3 | -23.8 | 107.3 | 127.3 | 134.8 |
| West | 93.8 | 83.0 | -12.7 | 92.3 | 109.5 | 128.6 |
by Tom Moeller March 6, 2008
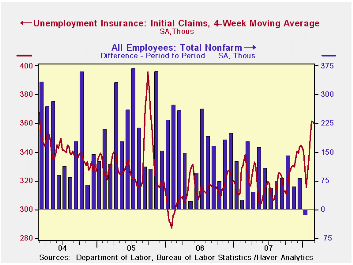
Initial claims for unemployment insurance fell 24,900 to 351,000 last week. The decline reversed all of the 21,000 increase during the prior week which was revised to show a slightly stronger rise. During February claims averaged 359,000 (+6.3% y/y) per week, up 9.8% from the January average.
A claims level below 400,000 typically has been associated with growth in nonfarm payrolls. During the last ten years there has been a (negative) 76% correlation between the level of initial claims and the m/m change in nonfarm payroll employment.
Continuing claims for unemployment insurance continued their
recent rise. A 29,000 increase during the latest week followed a 16,000
gain during the prior period which was revised down slightly. Insured
unemployment stood at its highest level since Summer 2005. The figure
provides some indication of workers' ability to find employment.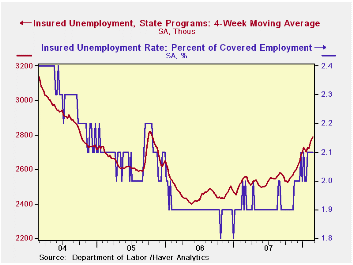
The continuing claims numbers lag the initial claims figures by one week.
The insured rate of unemployment remained at 2.1% for the fifth consecutive week.
The latest Beige Book from the Federal Reserve covering regional economic conditions can be found here.
An Expanded Look at Employment from the Federal Reserve Bank of St. Louis is available here.
| Unemployment Insurance (000s) | 03/01/08 | 02/23/08 | Y/Y | 2007 | 2006 | 2005 |
|---|---|---|---|---|---|---|
| Initial Claims | 351 | 375 | 7.3% | 322 | 313 | 331 |
| Continuing Claims | -- | 2,831 | 12.3% | 2,551 | 2,459 | 2,662 |
by Robert Brusca March 6, 2008
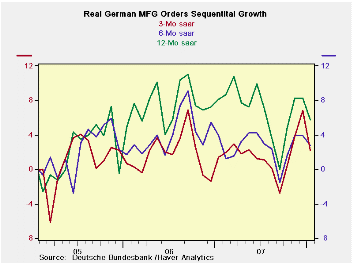
Manufacturing orders were a little weaker at the start of the year than in the fourth quarter said the German ministry in a classic understatement of the facts. It noted, however, mitigating factors, such as a change in the tax depreciation system at the start of 2008 that caused many domestic companies to pull their orders backward into 2007. Even with that pull back December orders fell. And the 2008 growth rate as of January 2008 compared to the Q4 base sees a 7.6% annual rate of decline in Q1 2008. Domestic orders are shrinking at a 2.4% pace. But foreign orders, an area unaffected by the depreciation rule in Germany, sees Q1 orders are off at a 12.3% annual pace.
German orders are being compressed. German domestic orders peaked in September 2006 and have been declining irregularly ever since. There was an order rebound in November and December of 2007 but the down shift is again in train.
In Germany sales trends show declines for consumer durables and nondurables. Sales of intermediate goods have seen resurgence while capital goods sales continue to be quite firm and have recently re-accelerated. This is a continuation of the same story that sees the consumer sector weak and capital goods remaining strong.
| German Orders and Sales By Sector and Origin | |||||||
|---|---|---|---|---|---|---|---|
| Real and SA | % M/M | % Saar | |||||
| Jan-08 | Dec-07 | Nov-07 | 3-MO | 6-Mo | 12-Mo | YrAgo | |
| Total Orders | -1.5% | -1.1% | 3.0% | 1.2% | 0.6% | 9.6% | 6.9% |
| Foreign | -1.3% | -2.5% | 2.3% | -5.9% | -3.0% | 13.3% | 5.6% |
| Domestic | -1.9% | 0.4% | 3.7% | 9.1% | 4.5% | 5.8% | 8.1% |
| Sector Sales | |||||||
| MFG/Mining | 1.4% | 1.1% | -0.7% | 7.3% | 3.6% | 5.9% | 9.1% |
| Consumer | -0.5% | 0.5% | -0.6% | -2.3% | -1.1% | 1.1% | 4.7% |
| Cons Durables | -2.6% | 2.8% | -0.2% | -0.4% | -0.2% | -1.5% | 7.0% |
| Cons Nondurable | 0.0% | -0.1% | -0.6% | -2.6% | -1.3% | 1.5% | 4.3% |
| Capital Goods | 2.7% | 0.9% | -2.1% | 6.0% | 3.0% | 7.9% | 11.3% |
| Intermediate Goods | 0.6% | 1.9% | 0.8% | 14.1% | 6.8% | 6.2% | 9.2% |
| All MFG Sales | 1.3% | 1.2% | -0.9% | 6.7% | 3.3% | 5.6% | 8.8% |
by Robert Brusca March 6, 2008
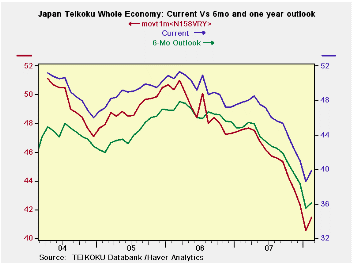
The Teikoku indices show a weakening Japan economy. Just today Japan policymakers, commenting on the state of the economy, were saying that it is weak and did not know if the word ‘recession’ should be used in connection with it. The Teikoku index hit a five year low in January and has recovered slightly in February. The NTC MFG index is also weak but not quite as weak as the Teikoku MFG reading; it is not in the bottom 5 percent of its range but in the bottom 30% of it.
The Teikoku outlook indices show that progressively greater weakness is expected looking ahead. While each of these indexes, the current, the 6-mo ahead and 12-mo ahead index, has fallen, each has also made a small rebound in February. Up until now, Japan has taken a mostly upbeat view of the economy. It took Japanese officials a long time to downgrade the economy and its prospects. But the slide in the economy is now undeniable. Still, like the US, we do not yet know how far the economy will skid.
| Key Japanese Surveys | |||||||
|---|---|---|---|---|---|---|---|
| Raw readings of each survey | Percent of 5Yr range* | ||||||
| Feb-08 | Jan-08 | Dec-07 | Nov-07 | Feb-08 | Jan-08 | Dec-07 | |
| NTC MFG | 50.8 | 52.4 | 52.3 | 50.8 | 30.5% | 47.4% | 47.3% |
| Econ Trends (Teikoku'/50 neutral/weighted diffusion) | |||||||
| MFG | 38.5 | 37.9 | 40.8 | 41.7 | 4.4% | 0.0% | 0.0% |
| Retail | 32.6 | 31.3 | 34.2 | 34.4 | 9.4% | 0.0% | 0.0% |
| Wholesale | 35.3 | 34.5 | 37.0 | 38.3 | 6.3% | 0.0% | 0.0% |
| Services | 41.0 | 40.4 | 43.5 | 45.0 | 5.4% | 0.0% | 20.1% |
| Construction | 29.7 | 28.9 | 32.0 | 32.6 | 7.5% | 0.0% | 16.4% |

Tom Moeller
AuthorMore in Author Profile »Prior to joining Haver Analytics in 2000, Mr. Moeller worked as the Economist at Chancellor Capital Management from 1985 to 1999. There, he developed comprehensive economic forecasts and interpreted economic data for equity and fixed income portfolio managers. Also at Chancellor, Mr. Moeller worked as an equity analyst and was responsible for researching and rating companies in the economically sensitive automobile and housing industries for investment in Chancellor’s equity portfolio. Prior to joining Chancellor, Mr. Moeller was an Economist at Citibank from 1979 to 1984. He also analyzed pricing behavior in the metals industry for the Council on Wage and Price Stability in Washington, D.C. In 1999, Mr. Moeller received the award for most accurate forecast from the Forecasters' Club of New York. From 1990 to 1992 he was President of the New York Association for Business Economists. Mr. Moeller earned an M.B.A. in Finance from Fordham University, where he graduated in 1987. He holds a Bachelor of Arts in Economics from George Washington University.
More Economy in Brief


