 Global| Sep 02 2009
U.S. Factory Inventory Decumulation Rate Eases Further
by:Tom Moeller
|in:Economy in Brief
Summary
Inventories still are being shed, but at a somewhat slower rate. That is a part of the recent improvement in the level of factory sector output. Manufactures' inventories during July fell 0.7% after a June decline that was revised [...]
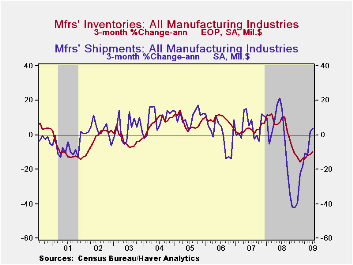
Inventories still are being shed, but at a somewhat slower rate. That is a part of the recent improvement in the level of factory sector output. Manufactures' inventories during July fell 0.7% after a June decline that was revised deeper to 1.1%. These still-significant declines are behind an easing of the decumulation rate to 10.0% from 15.9% this past Winter. Much of that deceleration is due, however, to lower oil prices. Nevertheless, excluding oil, factory inventories fell at a 12.2% three-month rate that was a slight moderation from 14.3% earlier.
The moderation in inventory decumulation rates continues spotty amongst various industries. Inventories of electrical equipment & appliances have fallen at a reduced 14.7% rate and machinery inventories fell at a still-firm 18.7% rate. Conversely, steep production cuts lowered furniture inventories at a 25.7% rate which was only slightly reduced. Inventories of primary metals also fell at a fairly stable 31.3% pace and computer inventory decumulation accelerated to a 18.1% rate during the last three months.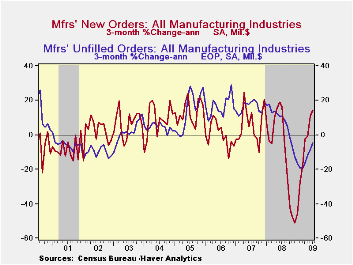
Factory shipments have started to rise moderately. On a three-month basis they're up at a 7.0% rate after the 40% plus rates of decline last Winter. The rate of decline in the machinery industry slowed to 3.1% after dropping at a 52.7% rate in March While in the electrical equipment sector the rate of decline slowed to 7.1% from 48.8%. Most elsewhere the rates of decline in shipments moderated substantially.
Finally, new orders have improved. The 1.3% increase during July was the fifth increase this year. It reflected a sharp monthly rise both in primary metals (-45.0% y/y) and electrical equipment (-20.2% y/y). Unfilled orders also fell at a sharply reduced 4.4% rate through July.
The Manufacturers' Shipments, Inventories and Orders (MSIO) data is available in Haver's USECON database.
Cross-Country Causes and Consequences of the 2008 Crisis: Early Warning from the Federal Reserve Bank of San Francisco can be found here.
| Factory Survey (NAICS, %) | July | June | Y/Y | 2008 | 2007 | 2006 |
|---|---|---|---|---|---|---|
| Inventories | -0.7 | -1.1 | -10.0 | 2.1 | 3.7 | 8.2 |
| Excluding Transportation | -1.1 | -1.4 | -13.1 | -0.6 | 2.7 | 7.9 |
| New Orders | 1.3 | 0.9 | -23.2 | 0.1 | 1.9 | 6.2 |
| Excluding Transportation | -0.7 | 2.7 | -23.2 | 3.1 | 1.2 | 7.4 |
| Shipments | -0.0 | 1.8 | -22.2 | 1.7 | 1.2 | 5.9 |
| Excluding Transportation | -0.1 | 1.9 | -22.4 | 3.7 | 1.5 | 6.7 |
| Unfilled Orders | -0.0 | -0.8 | -10.1 | 3.5 | 17.1 | 15.3 |
| Excluding Transportation | -0.3 | -0.1 | -14.9 | -1.0 | 8.2 | 16.0 |

Tom Moeller
AuthorMore in Author Profile »Prior to joining Haver Analytics in 2000, Mr. Moeller worked as the Economist at Chancellor Capital Management from 1985 to 1999. There, he developed comprehensive economic forecasts and interpreted economic data for equity and fixed income portfolio managers. Also at Chancellor, Mr. Moeller worked as an equity analyst and was responsible for researching and rating companies in the economically sensitive automobile and housing industries for investment in Chancellor’s equity portfolio. Prior to joining Chancellor, Mr. Moeller was an Economist at Citibank from 1979 to 1984. He also analyzed pricing behavior in the metals industry for the Council on Wage and Price Stability in Washington, D.C. In 1999, Mr. Moeller received the award for most accurate forecast from the Forecasters' Club of New York. From 1990 to 1992 he was President of the New York Association for Business Economists. Mr. Moeller earned an M.B.A. in Finance from Fordham University, where he graduated in 1987. He holds a Bachelor of Arts in Economics from George Washington University.
More Economy in Brief


