 Global| Aug 04 2008
U.S. Factory Inventories Up With Oil Prices
by:Tom Moeller
|in:Economy in Brief
Summary
Factory inventories surged 1.0% during June, thanks to the surge in oil prices. The value of inventories at petroleum refineries rose 9.5% (37.2% y/y) in June and the value is up by more than one-half since December as prices have [...]
Factory inventories surged 1.0% during June, thanks to the surge in oil prices. The value of inventories at petroleum refineries rose 9.5% (37.2% y/y) in June and the value is up by more than one-half since December as prices have surged. Less petroleum, factory inventories rose 0.4% (5.1% y/y) in June and YTD they rose 4.6%.
Less oil, the rate of inventory slowed. Automobile inventories fell at a 31.7% annual rate during the last three months. Inventory accumulation in the machinery sector also dropped to a 1.8% growth rate. Accumulation in the computer & electronics areas fell as well to a 1.0% rate of growth.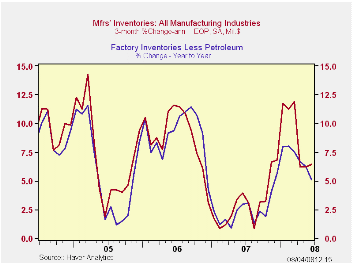
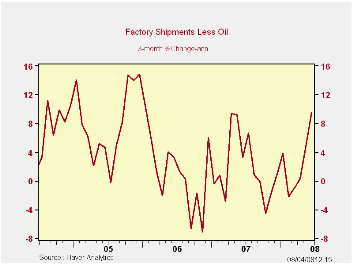
Factory shipments also surged, by 1.6%, due to oil. Shipments of petroleum surged by 5.6% (52.5% y/y). Less petroleum shipments rose (2.2% y/y) after a 0.5% May decline.
Total factory orders jumped by 1.7%, which was double expectations, again reflecting stronger petroleum orders (which equal shipments). Less petroleum, shipments did surge 1.0% (1.8% y/y) though the gain was making up for weakness earlier this year. Durable orders rose 0.8% which was the same as reported in the advance report, after a 0.1% May uptick.
Overall unfilled orders rose 0.9%, the same as they did in May. Order backlogs for civilian aircraft, which have been rising at a 25.3% rate, have started to cool. They were up just 0.4% in June Excluding the transportation sector altogether unfilled orders still rose 1.2% in June and at a 12.8% rate during the last three months. Accelerated growth in backlogs of machinery still account for much of that strength.
| Factory Survey (NAICS, %) | June | May | Y/Y | 2007 | 2006 | 2005 |
|---|---|---|---|---|---|---|
| Inventories | 1.0 | 0.6 | 7.0 | 3.7 | 6.4 | 8.9 |
| Excluding Transportation | 1.0 | 0.5 | 5.9 | 2.7 | 7.9 | 8.1 |
| New Orders | 1.7 | 0.9 | 7.1 | 1.9 | 6.2 | 11.9 |
| Excluding Transportation | 2.3 | 0.8 | 11.7 | 1.2 | 7.4 | 11.7 |
| Shipments | 1.6 | 0.3 | 7.5 | 1.2 | 5.9 | 10.4 |
| Excluding Transportation | 1.6 | 0.9 | 10.1 | 1.5 | 6.7 | 11.4 |
| Unfilled Orders | 0.9 | 0.9 | 15.3 | 17.1 | 15.3 | 15.4 |
| Excluding Transportation | 1.2 | 0.7 | 10.1 | 8.2 | 16.0 | 9.2 |

Tom Moeller
AuthorMore in Author Profile »Prior to joining Haver Analytics in 2000, Mr. Moeller worked as the Economist at Chancellor Capital Management from 1985 to 1999. There, he developed comprehensive economic forecasts and interpreted economic data for equity and fixed income portfolio managers. Also at Chancellor, Mr. Moeller worked as an equity analyst and was responsible for researching and rating companies in the economically sensitive automobile and housing industries for investment in Chancellor’s equity portfolio. Prior to joining Chancellor, Mr. Moeller was an Economist at Citibank from 1979 to 1984. He also analyzed pricing behavior in the metals industry for the Council on Wage and Price Stability in Washington, D.C. In 1999, Mr. Moeller received the award for most accurate forecast from the Forecasters' Club of New York. From 1990 to 1992 he was President of the New York Association for Business Economists. Mr. Moeller earned an M.B.A. in Finance from Fordham University, where he graduated in 1987. He holds a Bachelor of Arts in Economics from George Washington University.
More Economy in Brief


