 Global| Mar 04 2010
U.S. Factory Inventories Turn Toward Accumulation
by:Tom Moeller
|in:Economy in Brief
Summary
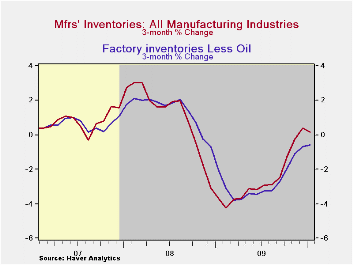
p Improved demand has changed attitudes about holding inventory. Factory inventories increased 0.2% during January and have risen during three of the last four months. That compares with sharp declines during the twelve months through [...]
 p
p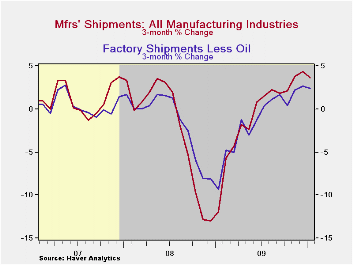
Improved demand has changed attitudes about holding inventory. Factory inventories increased 0.2% during January and have risen during three of the last four months. That compares with sharp declines during the twelve months through September which lowered inventory levels by 11.9%. Even accounting for higher oil prices there has been a turn. Without oil refineries factory inventories were roughly unchanged during the last four months and the -0.6% three-month change compares to -3.8% at its depth early last year.
Primary metals inventories during the last three months rose 3.1% after a 10.2% decline one-year ago. Electrical equipment inventories fell 0.8% after a 7.2% decline at its deepest last March and machinery inventories fell 1.8% versus at a 5.2% decline at the deepest last Spring. Even furniture inventories went down at a slower 2.5% three-month rate. In the nondurable area apparel inventories fell at a lessened 1.3% rate while paper products fell 1.7% versus -6.1% one year ago.
Higher factory shipments have encouraged the turn. Shipments rose 0.3% during January following four months of strength. Here again rising oil prices played a role. But even excluding oil, an unchanged January reading followed four months of strength. The three-month change has shifted to positive 2.4% from -9.4% one year ago. Shipments of machinery, electrical and transportation equipment have led the turn.
| Factory Survey (NAICS, %) | January | December | November | Y/Y | 2009 | 2008 | 2007 |
|---|---|---|---|---|---|---|---|
| Inventories | 0.2 | -0.2 | 0.2 | -7.5 | -8.7 | 2.2 | 3.7 |
| Excluding Transportation | 0.1 | -0.1 | 0.3 | -8.1 | -9.2 | -0.5 | 2.7 |
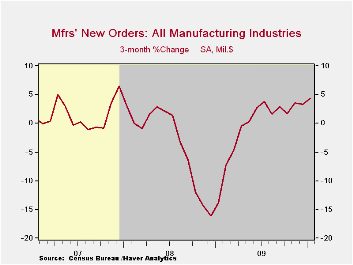
| New Orders | 1.7 | 1.5 | 1.0 | 9.5 | -17.2 | 0.0 | 1.9 |
| Excluding Transportation | 0.1 | 1.5 | 2.1 | 8.9 | -15.8 | 3.0 | 1.2 |
| Shipments | 0.3 | 1.8 | 1.6 | 5.5 | -15.2 | 1.6 | 1.2 |
| Excluding Transportation | 0.8 | 1.3 | 1.7 | 6.2 | -15.3 | 3.5 | 1.5 |
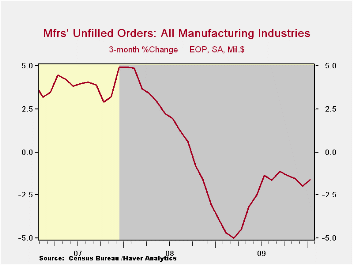
| Unfilled Orders | 0.0 | -0.9 | -0.7 | -8.5 | -10.2 | 3.4 | 17.1 |
| Excluding Transportation | -0.0 | 0.4 | 0.2 | -6.0 | -8.4 | -1.4 | 8.2 |

Tom Moeller
AuthorMore in Author Profile »Prior to joining Haver Analytics in 2000, Mr. Moeller worked as the Economist at Chancellor Capital Management from 1985 to 1999. There, he developed comprehensive economic forecasts and interpreted economic data for equity and fixed income portfolio managers. Also at Chancellor, Mr. Moeller worked as an equity analyst and was responsible for researching and rating companies in the economically sensitive automobile and housing industries for investment in Chancellor’s equity portfolio. Prior to joining Chancellor, Mr. Moeller was an Economist at Citibank from 1979 to 1984. He also analyzed pricing behavior in the metals industry for the Council on Wage and Price Stability in Washington, D.C. In 1999, Mr. Moeller received the award for most accurate forecast from the Forecasters' Club of New York. From 1990 to 1992 he was President of the New York Association for Business Economists. Mr. Moeller earned an M.B.A. in Finance from Fordham University, where he graduated in 1987. He holds a Bachelor of Arts in Economics from George Washington University.
More Economy in Brief


