 Global| Jul 02 2008
U.S. Factory Inventories Rose With Shipments
by:Tom Moeller
|in:Economy in Brief
Summary
Factory inventories increased 0.5% in May after little change during the prior month. As a result of recent moderation, the three-month growth rate eased further to 5.9% (AR), which was half the growth rates of this past Winter. The [...]
Factory inventories increased 0.5% in May after little change during the prior month. As a result of recent moderation, the three-month growth rate eased further to 5.9% (AR), which was half the growth rates of this past Winter.
The picture of more moderate rates of inventory accumulation was widespread. Automobile inventories, in fact, fell at a 34.3% rate during the last three months. Less the transportation sector altogether, inventories rose 0.5% in May but three-month growth fell to 4.4% from a double-digit rate of accumulation earlier this year.
Inventory accumulation in the machinery sector also eased to a
5.2% growth rate, which was half the earlier rate. Accumulation in the
computer & electronics areas also eased, but just slightly to
an 8.4% rate of growth. In the nondurables area inventories rose 0.6%
in May but three-month growth of 2.4% was down considerably versus the
double digit growth rate earlier this year.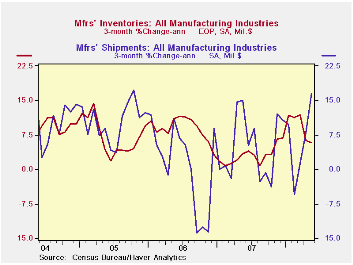
Factory shipments nudged up 0.1% after to 2.7% March surge. Shipments of petroleum surged again, in May by 4.0% (39.0% y/y). Less petroleum shipments fell 0.6% (+0.4% y/y). Growth of 5-7% had been the norm back from 2004-2006.
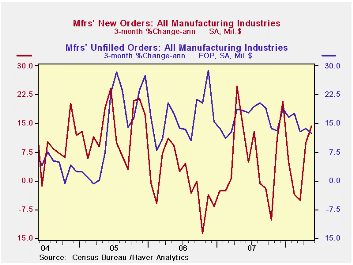
Total factory orders rose an expected 0.6% again reflecting stronger petroleum orders (which equal shipments). Less petroleum, shipments rose 0.1% and three-month growth was a moderate 2.6% (AR). Durable orders overall were unchanged, which was little different than reported in the advance report, after a 1.0% April decline.
Overall unfilled orders rose 0.9% in May and the three-month growth rate remained firm at 12.3%. Higher backlogs of civilian aircraft, which have been rising at a 25.3% rate, boosted the figure. Excluding the transportation sector altogether unfilled orders still rose 0.5% in May and at a 10.1% rate during the last three months. Accelerated growth in backlogs of machinery still account for much of that strength.
Why Are Goods So Cheap in Some Countries? from the Federal Reserve Bank of Philadelphia is available here.
| Factory Survey (NAICS, %) | May | April | Y/Y | 2007 | 2006 | 2005 |
|---|---|---|---|---|---|---|
| Inventories | 0.5 | -0.0 | 6.1 | 3.7 | 6.4 | 8.9 |
| Excluding Transportation | 0.5 | -0.2 | 5.0 | 2.7 | 7.9 | 8.1 |
| New Orders | 0.6 | 1.3 | 5.0 | 1.9 | 6.2 | 11.9 |
| Excluding Transportation | 0.4 | 2.8 | 7.4 | 1.2 | 7.4 | 11.7 |
| Shipments | 0.1 | 2.7 | 4.7 | 1.2 | 5.9 | 10.4 |
| Excluding Transportation | 0.6 | 2.9 | 7.2 | 1.5 | 6.7 | 11.4 |
| Unfilled Orders | 0.9 | 0.7 | 15.8 | 17.1 | 15.3 | 15.4 |
| Excluding Transportation | 0.5 | 1.1 | 8.5 | 8.2 | 16.0 | 9.2 |
by Tom Moeller July 2, 2008
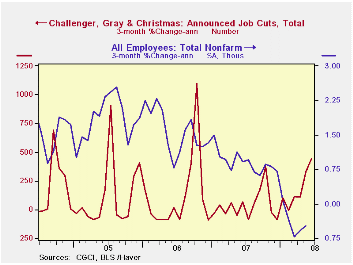
Job cut announcements fell 21.0% last month and reversed all of their rise during May, according to the Challenger, Grey & Christmas survey. The three-month rise in layoffs surged, however, to its highest level since early 2006.
A rise in the three-month average of job cut announcements in the financial, automotive, transportation and telecommunication sectors led the recent strength.
During the last ten years there has been a 76% (inverse) correlation between the three-month moving average of announced job cuts and the three-month change payroll employment.
Job cut announcements differ from layoffs. Many are achieved through attrition, early retirement or just never occur.
Challenger also reported that announced hiring plans again fell sharply (-63.7% y/y).
The Evolution of World Income Distribution from the Federal Reserve Bank of Philadelphia can be found here.
| Challenger, Gray & Christmas | June | May | Y/Y | 2007 | 2006 | 2005 |
|---|---|---|---|---|---|---|
| Announced Job Cuts | 81,755 | 103,522 | 46.7% | 768,264 | 839,822 | 1,072,054 |
by Tom Moeller July 2, 2008
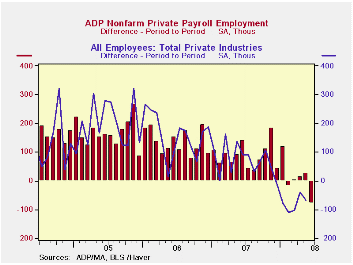
The ADP National Employment Report, from the payroll processor, reported that private nonfarm payrolls fell 79,000 last month after a revised 25,000 increase during May. Declines in payrolls reported for earlier months this year were revised to show modest increases.
The U.S. Bureau of Labor Statistics will report on June nonfarm payrolls tomorrow. Last month, the 25,000 worker rise in ADP's measure of private nonfarm payrolls was accompanied by a 66,000 worker decline in the BLS measure of private sector payrolls.According to ADP and Macro Advisers, the correlation between the monthly percentage change in the ADP estimate and that in the BLS data is 0.90.
The ADP sub-index for large payrolls fell 51,000 (-1.2% y/y) after a 19,000 worker decline during May.
Medium sized payrolls also were quite weak and posted a 35,000 (+0.4% y/y) decline.
A 7,000 worker increase (1.1% y/y) in small sized payrolls during June was much reduced after the 50,000 May increase.
Employment in the goods producing industries fell a huge 76,000 (-2.4% y/y) and the rate of decline has intensified as this year has progressed. Services payrolls also fell but by a lesser 3,000 (1.2% y/y).
ADP compiled the estimate from its database of individual companies' payroll information. Macroeconomic Advisers, LLC, the St. Louis economic consulting firm, developed the methodology for transforming the raw data into an economic indicator.
The ADP National Employment Report data is maintained in Haver's
USECON database; historical data go back to December 2000. The figures in this report cover only private sector jobs and exclude employment in the public sector, which rose an average 11,083 during the last twelve months.The full ADP National Employment Report can be found here, and the ADP methodology is explained here.
| LAXEPA@USECON | June | May | Y/Y | 2007 | 2006 | 2005 |
|---|---|---|---|---|---|---|
| Nonfarm Private Payroll Employment (m/m Chg.) | -79,000 | 25,000 | 0.7% | 1.1% | 1.7% | 1.8% |
by Robert Brusca July 2, 2008
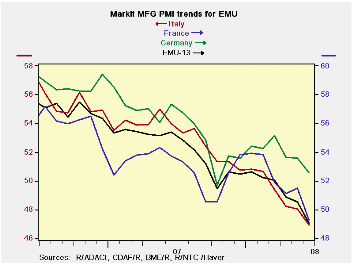
The June EMU MFG PMI moved below 50 for the first time since
June of 2005. This signals EMU-wide MFG contraction. The dip comes
ahead of a meeting of the ECB when it is expected to hike rates. EMU
member finance ministers have been warning the ECB of the potential for
a rate hike to turn growth negative in the e-Zone. Meanwhile, in the
interest rate and exchange rate sensitive MFG sector it already has
happened- at least by one measure.
Of the three largest EMU economies, two are registering
contraction in MFG by the Market PMI measures: Italy and France. The
Euro-Area’s strongest and largest economy, Germany remains in positive
territory – but is easing.
The Euro Area plus Italy and France show that the economy is
losing momentum at a rapid pace. Germany, on the other hand, has
rebounded from its weakest reading and is losing momentum at a slower
pace.
Still, the negative reading for the Euro Area's overall MFG
PMI does not make it easier for the ECB to do what it seems already to
have decided to do - that is to hike rates. Since the ECB began
considering a rate hike more seriously, inflation has overrun the ECB
ceiling by an even larger amount. Headline inflation is now is at more
that twice the pace that the ceiling allows, leaving the ECB chasing
after its own credibility. This is a race that the ECB is determined to
win.
| NTC MFG Indices | |||||||
|---|---|---|---|---|---|---|---|
| Jun-08 | May-08 | Apr-08 | 3Mo | 6Mo | 12Mo | Percentile | |
| Euro-13 | 49.16 | 50.60 | 50.74 | 50.17 | 51.27 | 52.25 | 37.2% |
| Germany | 52.56 | 53.57 | 53.62 | 53.25 | 53.93 | 54.18 | 60.3% |
| France | 49.24 | 51.48 | 51.12 | 50.61 | 51.91 | 52.07 | 31.7% |
| Italy | 46.91 | 48.05 | 48.24 | 47.73 | 49.01 | 50.57 | 24.2% |
| Spain | 40.61 | 43.79 | 45.19 | 43.20 | 45.42 | 48.21 | 0.0% |
| Austria | 48.39 | 49.76 | 49.83 | 49.33 | 51.31 | 52.71 | 32.6% |
| Greece | 53.81 | 53.77 | 54.38 | 53.99 | 53.08 | 53.50 | 63.6% |
| Ireland | 44.71 | 45.21 | 44.69 | 44.87 | 46.13 | 49.39 | 0.2% |
| Netherlands | 51.07 | 51.46 | 51.45 | 51.33 | 52.02 | 53.99 | 49.5% |
| EU | |||||||
| UK | 45.79 | 49.46 | 50.34 | 48.53 | 49.65 | 52.02 | 2.8% |
| percentile is over range since March 2000 | |||||||
by Robert Brusca July 2, 2008
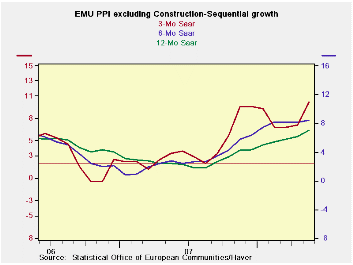
The charts show that trends in the PPI are still working their
way higher. The table shows that energy and manufacturing sector
inflation trends as well as the total excluding construction embody
accelerating trends. Headline inflation is accelerating in Germany,
Italy, France and the UK. Core inflation is accelerating steadily in
those countries too, except for France and Germany. In Germany core
inflation accelerated over 6-mo compared to 12 months then leveled off
at 4%. In France Inflation accelerated to 4.2% over six months from
3.5% over 12-months then backed off to 4% over three-months. So
countries where the core is not accelerating are not showing much in
the way of hopeful trends either.
None of these inflation rates is acceptable to the ECB. For
the PPI even core inflation rates are running DOUBLE the ceiling that
has been set for headline HICP inflation rate. No wonder the ECB is
widely believed to be readying a rate hike.
| Euro Area and UK PPI Trends | ||||||
|---|---|---|---|---|---|---|
| M/M | Saar | |||||
| Euro Area 13 | May-08 | Apr-08 | 3-Mo | 6-MO | Yr/Yr | Y/Y Yr Ago |
| Total excl Construction | 1.2% | 0.9% | 11.7% | 9.2% | 7.1% | 2.4% |
| Excl Energy | 0.3% | 0.4% | 4.5% | 4.9% | 3.8% | 3.2% |
| Capital Goods | 0.2% | 0.2% | 2.2% | 2.7% | 1.8% | 2.0% |
| Consumer Goods | 0.1% | 0.2% | 2.6% | 3.8% | 4.5% | 1.7% |
| Intermediate & Capital Goods | 0.4% | 0.5% | 5.5% | 5.5% | 3.4% | 4.1% |
| Energy | 4.1% | 2.1% | 36.7% | 23.7% | 18.2% | -0.1% |
| MFG | 1.3% | 0.6% | 11.2% | 8.0% | 6.3% | 2.6% |
| Germany | 1.0% | 1.1% | 11.6% | 8.8% | 6.0% | 1.9% |
| Germany Ex Energy | 0.4% | 0.4% | 4.0% | 4.0% | 2.9% | 2.7% |
| France | 1.3% | 0.8% | 11.0% | 7.9% | 6.7% | 1.8% |
| France Ex Energy | 0.3% | 0.4% | 4.0% | 4.2% | 3.5% | 2.7% |
| Italy | 1.5% | 0.4% | 11.9% | 9.2% | 7.5% | 3.0% |
| Italy Ex Energy | 0.2% | 0.5% | 5.5% | 5.3% | 3.8% | 3.7% |
| UK | 1.7% | 2.3% | 21.1% | 17.9% | 16.5% | 0.2% |
| UK Ex Energy | 1.2% | 1.0% | 11.8% | 9.7% | 6.3% | 3.2% |
| Euro Area 13 Harmonized PPI excluding Construction | ||||||
| The EA 13 countries are Austria, Belgium, Finland, France, Germany, Greece, Ireland, Italy, Luxembourg, the Netherlands, Portugal, Slovenia | ||||||

Tom Moeller
AuthorMore in Author Profile »Prior to joining Haver Analytics in 2000, Mr. Moeller worked as the Economist at Chancellor Capital Management from 1985 to 1999. There, he developed comprehensive economic forecasts and interpreted economic data for equity and fixed income portfolio managers. Also at Chancellor, Mr. Moeller worked as an equity analyst and was responsible for researching and rating companies in the economically sensitive automobile and housing industries for investment in Chancellor’s equity portfolio. Prior to joining Chancellor, Mr. Moeller was an Economist at Citibank from 1979 to 1984. He also analyzed pricing behavior in the metals industry for the Council on Wage and Price Stability in Washington, D.C. In 1999, Mr. Moeller received the award for most accurate forecast from the Forecasters' Club of New York. From 1990 to 1992 he was President of the New York Association for Business Economists. Mr. Moeller earned an M.B.A. in Finance from Fordham University, where he graduated in 1987. He holds a Bachelor of Arts in Economics from George Washington University.
More Economy in Brief


