 Global| Sep 03 2008
U.S. Factory Inventories Rose Again
by:Tom Moeller
|in:Economy in Brief
Summary
Factory inventories rose 0.5% during July, lifted by a 3.5% surge in inventories of nondefense aircraft & parts. Less the transportation sector altogether the value of inventories rose 0.4%. At petroleum refineries, inventories fell [...]
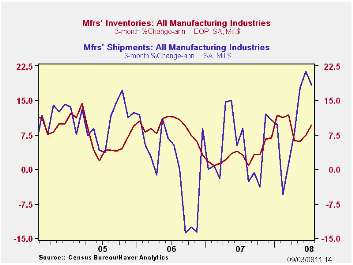
Factory inventories rose 0.5% during July, lifted by a 3.5% surge in inventories of nondefense aircraft & parts. Less the transportation sector altogether the value of inventories rose 0.4%.
At petroleum refineries, inventories fell 1.9% (+37.1% y/y) after a revised 10.0% jump during June. The value still was up by more than one-half since December as prices have surged. Less petroleum, factory inventories rose 0.7% (5.8% y/y) during July after an upwardly revised 0.6 June increase. Inventories in the machinery sector rose 0.5% (5.8% y/y) while inventories of computers & electronics rose 0.4% (7.2 y/y).
Factory shipments jumped again last month. The 2.1% spike was due to a 3.8% (-10.5% y/y) surge in shipments of transportation equipment and a 2.0% (13.3% y/y) rise in apparel shipments.
Total factory orders surged 1.3% during July after the upwardly revised 2.1% June jump. Expectations had been for a 1.0% rise. The strength reflected stronger petroleum orders (which equal shipments). They rose 0.6% (48.8% y/y). Less petroleum, orders rose 1.4% (0.3% y/y). Durable orders repeated their June strength and rose 1.3% which was the same as reported in the advance report.
Overall unfilled orders rose 0.7%, a rate of increase that was down from the 1.0% June rise. Order backlogs for electronic computers fell slightly but order backlogs of machinery surged (23.2% y/y).
| Factory Survey (NAICS, %) | July | June | Y/Y | 2007 | 2006 | 2005 |
|---|---|---|---|---|---|---|
| Inventories | 0.5 | 1.2 | 7.6 | 3.7 | 6.4 | 8.9 |
| Excluding Transportation | 0.4 | 1.3 | 6.6 | 2.7 | 7.9 | 8.1 |
| New Orders | 1.3 | 2.1 | 5.3 | 1.9 | 6.2 | 11.9 |
| Excluding Transportation | 1.0 | 2.7 | 10.6 | 1.2 | 7.4 | 11.7 |
| Shipments | 2.1 | 1.9 | 7.8 | 1.2 | 5.9 | 10.4 |
| Excluding Transportation | 1.8 | 1.9 | 10.8 | 1.5 | 6.7 | 11.4 |
| Unfilled Orders | 0.7 | 1.0 | 13.7 | 17.1 | 15.3 | 15.4 |
| Excluding Transportation | 1.0 | 1.4 | 10.0 | 8.2 | 16.0 | 9.2 |
by Tom Moeller September 3, 2008
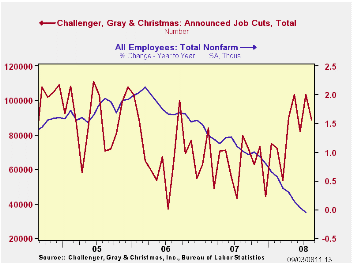
Job cut announcements fell a sharp 14.1% last month and reversed roughly all of their 26.4% jump during July, according to the Challenger, Grey & Christmas survey.
The three-month level layoffs also fell but remained near the highest level since early-2006.
The decline in layoffs fell last month was led by fewer job cuts in the entertainment/leisure, media, and financial industries. Large increases were logged in the transportation, automotive and the industrial goods industries.
During the last ten years there has been a 76% (inverse) correlation between the three-month moving average of announced job cuts and the three-month change payroll employment.
Job cut announcements differ from layoffs. Many are achieved through attrition, early retirement or just never occur.
Challenger also reported that announced hiring plans fell sharply m/m but they were up 17.1% y/y.
On the Evolution of Income Inequality in the United States from the Federal Reserve Bank of Richmond can be found here.
| Challenger, Gray & Christmas | August | July | Y/Y | 2007 | 2006 | 2005 |
|---|---|---|---|---|---|---|
| Announced Job Cuts | 88,736 | 103,312 | 11.7% | 768,264 | 839,822 | 1,072,054 |
by Tom Moeller September 3, 2008
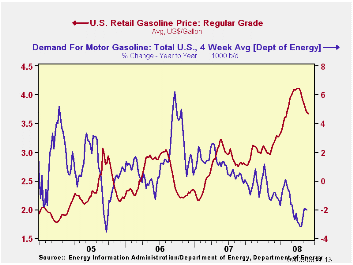
The pump price for a gallon of regular gasoline
was roughly unchanged last week at $3.68 per gallon, according to the
U.S. Department of Energy survey. The price, nevertheless, has fallen
by 44 cents, or more than ten percent from the peak in early July. For
all grades of gasoline the average price fell last week by two cents to
$3.72 per gallon.
Yesterday the spot market price for a gallon of regular
gasoline dropped eight cents from Friday's level to $2.85 per gallon.
Prices had run up, however, ahead of Hurricane Gustav. They have fallen
now that oil facilities were largely missed by the storm. Prices are
down another two cents this morning.
Weekly gasoline prices can be found in Haver's WEEKLY
database, daily prices are in the DAILY
database.
According to the U.S. Department of Energy, the demand for
gasoline fell a slight 0.1% during the last four weeks and it was down
2.0% from a year earlier.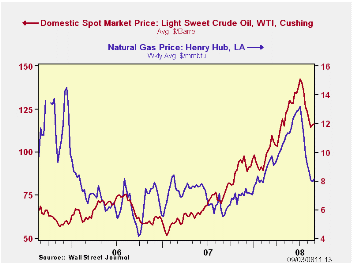
The DOE figures are available in Haver's OILWKLY
database.
The price for a barrel of West Texas Intermediate crude oil
ticked up last week to an average $116.60 per barrel. That's down from
the high early last month of $142.46.
Prices for natural gas ticked up w/w to an average $8.12 per
mmbtu (+47.0% y/y). The high for natural gas prices was in early-July
at $13.19/mmbtu.
What is the Monetary Standard, Or, How Did the
Volcker-Greenspan FOMCs Tame Inflation? from the Federal
Reserve Bank of Richmond can be found here.
| Weekly Prices | 09/01/08 | 08/25/08 | Y/Y | 2007 | 2006 | 2005 |
|---|---|---|---|---|---|---|
| Retail Regular Gasoline ($ per Gallon) | 3.68 | 3.69 | 31.6% | 2.80 | 2.57 | 2.27 |
| Light Sweet Crude Oil, WTI ($ per bbl.) | 116.55 | 115.60 | 59.8% | 72.25 | 66.12 | 56.60 |
by Tom Moeller September 3, 2008
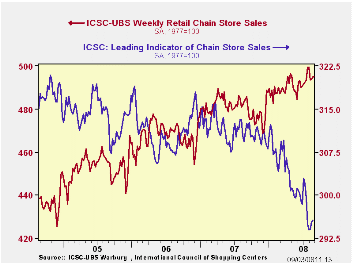
According to the International Council of Shopping Centers, chain store sales inched up another 0.1% last week after the 0.2% uptick during the week prior. For all of August sales rose 0.2% from the July average after that month's 0.5% rise.
During the last ten years there has been a 45% correlation between the y/y change in chain store sales and the change in nonauto retail sales less gasoline.
The ICSC-UBS retail chain-store sales index is constructed using the same-store sales (stores open for one year) reported by 78 stores of seven retailers: Dayton Hudson, Federated, Kmart, May, J.C. Penney, Sears and Wal-Mart.
The leading indicator of chain store sales from ICSC-UBS fell 0.3% (-4.4% y/y) and that reversed the prior week's increase./p>
The chain store sales figures are available in Haver's SURVEYW database.
The Advantage of Flexible Targeting Rules from the Federal Reserve Bank of New York is available here.
| ICSC-UBS (SA, 1977=100) | 08/29/08 | 08/22/08 | Y/Y | 2007 | 2006 | 2005 |
|---|---|---|---|---|---|---|
| Total Weekly Chain Store Sales | 495.1 | 494.7 | 2.2% | 2.8% | 3.3% | 3.6% |
by Robert Brusca September 3, 2008
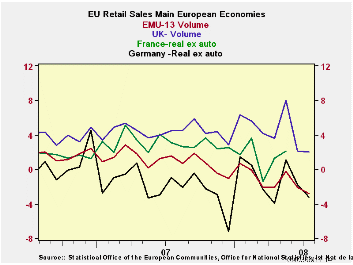
Euro Area 15 retail sales are off by 0.4% in July their second straight month of declining. Food and nonfood sales each are off for two months running as well. In the current quarter to date sales volumes overall are falling at a 4.8% annual rate. For food alone the new in-quarter drop is at a pace of -7.5% while nonfood sales are contracting at a -2.3% annual rate.
The detail on sales lags the headline availability by one month. Since May was a bit of an ‘up month’ even the declines in June do not produce much of a trend of weakness for the area by detailed group. But by July the back-to-back declines in overall sales should make the withering trends by retail sales component more apparent. German sales volume trends ex autos are clearly pointing lower as are even the lagged Italian trends. For the UK, however, sales trends are still holding up as of July. May and June brought horrific sales swings (offsetting) to the UK and will make trend reading a bit harder to make sense of in the coming months.
The consumer is an important part of the Euro Area economy and now retail sales are off sharply. Private consumption is 56% of Euro Area GDP. But capital spending at 23% is another huge chunk of it. Euro exports and imports are each about 45% of GDP while in the US the comparable ratio is about 15%. So while the consumer is important for Europe at 56% of GDP the US ratio of 70% makes the consumer relatively more of a force there. Still, having such weakness for 56% of your economy is not a good sign. And Europe is showing slowing across private consumption as well as capital formation. Net exports have been gradually supplying less and less of a boost to GDP. Losing the consumer to the forces of negative growth will be a blow to the European economies.
| Euro Area 15 Retail Sales Volume | ||||||
|---|---|---|---|---|---|---|
| Jul-08 | Jun-08 | May-08 | 3-Mo | 6-MO | 12-Mo | |
| Euro Area 15 Total | -0.4% | -0.8% | 0.6% | -2.9% | -4.4% | -3.0% |
| Food | -0.8% | -0.7% | 0.0% | -5.9% | -4.6% | -3.6% |
| NonFood | -0.1% | -0.9% | 1.0% | -0.1% | -3.9% | -2.4% |
| Textiles | #N/A | -2.6% | 6.1% | 11.3% | -0.7% | -2.7% |
| Books news, etc | #N/A | -1.0% | -0.2% | 0.6% | -0.1% | -1.6% |
| Pharmaceutical | #N/A | 0.5% | -0.4% | 2.9% | 1.7% | 2.3% |
| Other NonSpec | #N/A | -1.7% | 0.6% | -1.0% | -1.8% | -2.8% |
| Mail Order | #N/A | -1.2% | -1.0% | 1.1% | -5.3% | -3.4% |
| Country detail;Volume | ||||||
| Germany:VolxAuto | -1.5% | -1.4% | 1.3% | -6.2% | -5.4% | -3.2% |
| Italy(Total; Value) | #N/A | -0.5% | 0.2% | -1.1% | -1.3% | -1.0% |
| UK(EU):Vol | 0.8% | -4.3% | 4.0% | 1.2% | 0.4% | 2.0% |
| Shaded areas calculated on a one-month lag due to lagging data. | ||||||

Tom Moeller
AuthorMore in Author Profile »Prior to joining Haver Analytics in 2000, Mr. Moeller worked as the Economist at Chancellor Capital Management from 1985 to 1999. There, he developed comprehensive economic forecasts and interpreted economic data for equity and fixed income portfolio managers. Also at Chancellor, Mr. Moeller worked as an equity analyst and was responsible for researching and rating companies in the economically sensitive automobile and housing industries for investment in Chancellor’s equity portfolio. Prior to joining Chancellor, Mr. Moeller was an Economist at Citibank from 1979 to 1984. He also analyzed pricing behavior in the metals industry for the Council on Wage and Price Stability in Washington, D.C. In 1999, Mr. Moeller received the award for most accurate forecast from the Forecasters' Club of New York. From 1990 to 1992 he was President of the New York Association for Business Economists. Mr. Moeller earned an M.B.A. in Finance from Fordham University, where he graduated in 1987. He holds a Bachelor of Arts in Economics from George Washington University.
More Economy in Brief


