 Global| Jan 04 2006
U.S. Factory Inventories and Backlogs Up
by:Tom Moeller
|in:Economy in Brief
Summary
November factory inventories rose 0.2% following an unrevised 0.6% gain in October. Less a 3.2% (+14.4% y/y) decline in petroleum, factory inventories rose 0.3% (3.3% y/y) and that y/y gain is nearly one third the rate of accumulation [...]
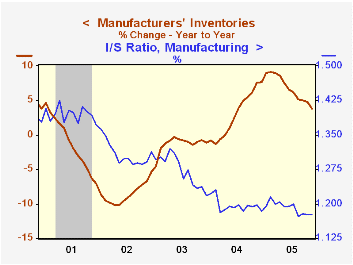
November factory inventories rose 0.2% following an unrevised 0.6% gain in October. Less a 3.2% (+14.4% y/y) decline in petroleum, factory inventories rose 0.3% (3.3% y/y) and that y/y gain is nearly one third the rate of accumulation early in 2005.
The increase in November inventories was paced by a 1.4% (1.3% y/y) gain in computers & electronic products. Machinery inventories also rose a strong 0.5% (5.9% y/y).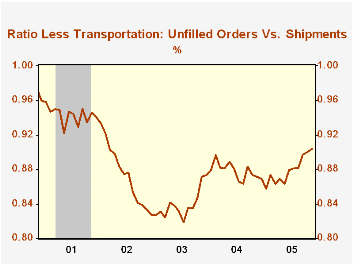
Factory shipments rose a modest 0.2%, held back by a 5.7% drop in petroleum. Total factory orders surged 2.5% and the advance report of a 4.4% jump in durables goods orders was unrevised.
A 10.6% m/m surge (46.9% y/y) in unfilled orders for nondefense aircraft orders caused the total of unfilled orders to jump 1.6%. Less the transportation sector backlogs continued strong and rose 0.6% (9.6% y/y) while the ratio of total unfilled orders to shipments rose further to the highest level since 2002.
| Factory Survey (NAICS) | Nov | Oct | Y/Y | 2004 | 2003 | 2002 |
|---|---|---|---|---|---|---|
| Inventories | 0.2% | 0.6% | 3.8% | 7.7% | -1.1% | -5.4% |
| New Orders | 2.5% | 1.7% | 8.7% | 9.3% | 3.5% | -2.5% |
| Shipments | 0.2% | 0.7% | 5.7% | 9.5% | 1.5% | -2.5% |
| Unfilled Orders | 3.0% | 1.4% | 13.9% | 8.4% | 8.0% | -8.5% |
by Tom Moeller January 4, 2006
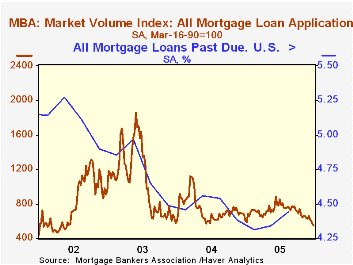
The total number of mortgage applications fell another 1.5% last week on top of the 6.8% drop the previous week. The decline rounded out 2005 when the average level fell 3.6% y/y after a nearly one third drop during 2004.
Purchase applications have been notably weak during the last several weeks. The 3.4% drop last week pulled the December average of purchase applications down 3.7% from November and the latest week was down 21.0% from the high during June.
During the last ten years there has been a 50% correlation between the y/y change in purchase applications and the change in new plus existing single family home sales
Applications to refinance recovered 8.3% of the prior week's 11.2% plunge yet the December average fell 13.8% from November.
The Mortgage Bankers Association also reported that through 3Q05, the percentage of mortgage loans past due crept higher to 4.44% versus the 1Q low 4.31%. The increase was due to higher delinquencies in the South. In the Northeast and in the West delinquencies are near or at the series' low. In the Midwest, however, a decline last quarter ran counter to the rising trend of the last ten years when the delinquency rate rose to roughly 5% from 3.6% in 1994.
The effective interest rate on a conventional 30-year mortgage fell slightly for the fourth straight week. At 6.42% the rate was down from 6.58% at the start of the month and averaged 6.48% in December versus a low average 5.81% in June. The effective rate on a 15-year mortgage was 6.05%. The interest rates on 15 and 30 year mortgages are closely correlated (>90%) with the rate on 10 year Treasury securities.
The Mortgage Bankers Association surveys between 20 to 35 of the top lenders in the U.S. housing industry to derive its refinance, purchase and market indexes. The weekly survey accounts for more than 40% of all applications processed each week by mortgage lenders. Visit the Mortgage Bankers Association site here.
The minutes to the latest meeting of the Federal Open Market Committee can be found here.
| MBA Mortgage Applications (3/16/90=100) | 12/30/05 | 12/23/05 | Y/Y | 2005 | 2004 | 2003 |
|---|---|---|---|---|---|---|
| Total Market Index | 545.9 | 554.1 | -9.9% | 708.6 | 735.1 | 1,067.9 |
| Purchase | 418.3 | 432.9 | 0.2% | 470.9 | 454.5 | 395.1 |
| Refinancing | 1,363.2 | 1,259.1 | -19.9% | 2,092.3 | 2,366.8 | 4,981.8 |
by Carol Stone January 4, 2006
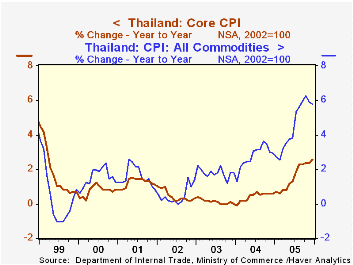
The overall CPI for Thailand was flat in December from November, when it had fallen 0.4% from October. But the total index for the year was up 5.8%, exactly double the increase in 2004. The December "core" rate, excluding raw food and energy, was 2.6%, compared with a mere 0.6% in 2004 and zero in 2003. This is the highest core rate for Thailand since the aftermath of the currency crises in 1997-98. Thus, this marked advance in core inflation in 2005, indicates at least one nation where energy prices forced up some other costs enough to show through in core and total inflation outcomes. These data were reported today by the Thai Ministry of Commerce and are contained in Haver's EMERGEPR database.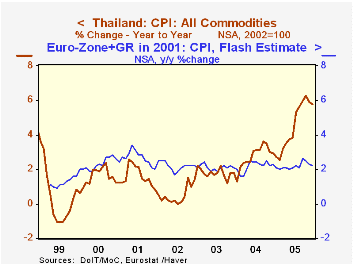
As regular readers might be aware, we have monitored consumer prices throughout 2005 for signs of second-round effects of surging energy costs on other prices and have found precious little evidence of this. In the table below, we include data for Italy and the "flash" estimate for the Euro-Zone, which were both released today as well. They show that total inflation was steady or lower in 2005 compared with 2004, and through November, the Euro-Zone core CPI (excludes energy and unprocessed food) was 1.5%, lower than 2.1% across all of 2004.
In Thailand, though, there was apparently some pass-through of energy large enough to impact core inflation. Several categories experienced larger price increases last year, and the most notable was transportation and communication. This sector began to trend upward more rapidly in the spring of 2004 and continued to accelerate during 2005, reaching 13.3% in December, year-on-year. World Bank reports indicate that the government had been subsidizing diesel fuel and discontinued this subsidy; this added to the price increase from the cost of the fuel alone and led to substantially greater diesel costs in 2005, which apparently then generated a sizable rise in transportation costs generally in Thailand. This effect may not spread, especially since it was due to a change in Thai government price policy as well as the raw material cost, so we would conclude in this instance that the pick-up in Thai core inflation is "the exception that proves the rule" that general world-wide inflation has been remarkably impervious to the enormous rises in energy prices. Whether this will last through the winter heating season in the northern hemisphere remains to be seen, however.
| Thailand | Dec 2005 | Nov 2005 | Oct 2005 | December/December|||
|---|---|---|---|---|---|---|
| 2004 | 2003 | 2002 | ||||
| All Commodities (SA) | 0.0 | -0.4 | 0.4 | -- | -- | -- |
| Yr/Yr % (NSA) | 5.8 | 5.9 | 6.2 | 2.9 | 1.8 | 1.4 |
| Core CPI (SA) | 0.2 | 0.0 | 0.2 | -- | -- | -- |
| Yr/Yr % (NSA) | 2.6 | 2.4 | 2.4 | 0.6 | 0.0 | 0.3 |
| Transportation & Communication (SA) | 0.2 | -0.7 | 0.1 | -- | -- | -- |
| Yr/Yr % (NSA) | 13.3 | 11.3 | 13.1 | 4.1 | 3.1 | 4.7 |
| Memo: Italy CPI (NSA, Yr/Yr %) | 2.0 | 2.2 | 2.2 | 2.0 | 2.5 | 2.8 |
| Euro-Zone CPI "Flash" (NSA, Yr/Yr %) | 2.2 | 2.3 | 2.5 | 2.4 | 2.0 | 2.3 |

Tom Moeller
AuthorMore in Author Profile »Prior to joining Haver Analytics in 2000, Mr. Moeller worked as the Economist at Chancellor Capital Management from 1985 to 1999. There, he developed comprehensive economic forecasts and interpreted economic data for equity and fixed income portfolio managers. Also at Chancellor, Mr. Moeller worked as an equity analyst and was responsible for researching and rating companies in the economically sensitive automobile and housing industries for investment in Chancellor’s equity portfolio. Prior to joining Chancellor, Mr. Moeller was an Economist at Citibank from 1979 to 1984. He also analyzed pricing behavior in the metals industry for the Council on Wage and Price Stability in Washington, D.C. In 1999, Mr. Moeller received the award for most accurate forecast from the Forecasters' Club of New York. From 1990 to 1992 he was President of the New York Association for Business Economists. Mr. Moeller earned an M.B.A. in Finance from Fordham University, where he graduated in 1987. He holds a Bachelor of Arts in Economics from George Washington University.
More Economy in Brief


