 Global| Mar 23 2010
U.S. Existing Home Sales RemainDepressed
by:Tom Moeller
|in:Economy in Brief
Summary
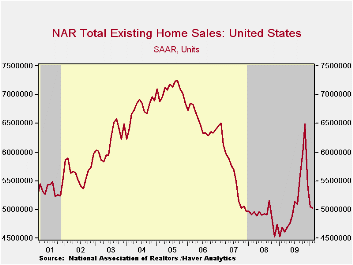
It probably was the weather that helped depress home sales last month. The National Association of Realtors reported that sales of existing homes fell 0.6% from January as winter storms again blanketed the East and Midwest regions. [...]
 It probably was the weather
that helped depress home sales
last month. The National Association of Realtors reported that sales of
existing homes fell 0.6% from January as winter storms again
blanketed the East and Midwest regions. The slip to 5.0200M units
(SAAR) followed a little-revised 7.2% January decline and a sharper
16.2% December slump. February sales were the lowest since last June
and roughly matched Consensus expectations. Total sales include sales
of condos and co-ops. Sales of existing single-family homes alone fell
a larger 1.4% from January to 4.370M. (These data have a longer history
than the total sales series). Sales of condos and co-ops rose by nearly
one-third from the last year.
It probably was the weather
that helped depress home sales
last month. The National Association of Realtors reported that sales of
existing homes fell 0.6% from January as winter storms again
blanketed the East and Midwest regions. The slip to 5.0200M units
(SAAR) followed a little-revised 7.2% January decline and a sharper
16.2% December slump. February sales were the lowest since last June
and roughly matched Consensus expectations. Total sales include sales
of condos and co-ops. Sales of existing single-family homes alone fell
a larger 1.4% from January to 4.370M. (These data have a longer history
than the total sales series). Sales of condos and co-ops rose by nearly
one-third from the last year.
Sales have been helped by a recently extended tax credit for first-time home buyers. The credit of up to $8,000 which runs though April 30. Additionally, a new credit of up to $6,500 is available to some existing home owners who move. The full details of the home-buyer tax credit can be found here.
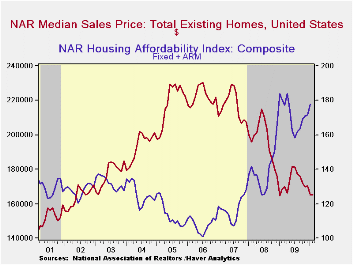
The median price of all existing homes was roughly unchanged last month at $165,100 but off 30% from the 2007 peak. The price of a single-family home inched up m/m to $164,300 (-2.1% y/y). Price weakness sharply raised home affordability; by 7.8% since July and by two-thirds from the 2006 low. The median family income for existing home buyers was $60,494 and mortgage payments amounted to 14.1% of that total.
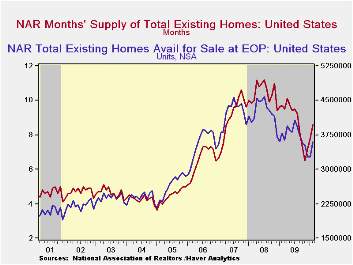
The number of unsold homes (single-family & co-ops) for sale rose 9.5%. However, it was down from last year and near the lowest since 2006. At the current sales rate there was an 8.6 months' supply of homes on the market. The latest figure was up m/m due to depressed sales but still down from a high of 11.3 months during April of 2008. For single-family homes, the inventory rose m/m to an 8.2 months' supply, near the lowest since 2007.
| Existing Home Sales (Thous, SAAR) | February | January | December | Feb. Y/Y | 2009 | 2008 | 2007 |
|---|---|---|---|---|---|---|---|
| Total | 5,020 | 5,050 | 5,440 | 7.0% | 5,160 | 4,893 | 5,674 |
| Northeast | 840 | 820 | 920 | 12.0 | 863 | 845 | 1,010 |
| Midwest | 1,110 | 1,080 | 1,160 | 8.8 | 1,166 | 1,130 | 1,331 |
| South | 1,850 | 1,870 | 2,020 | 6.9 | 1,913 | 1,860 | 2,243 |
| West | 1,220 | 1,280 | 1,350 | 3.4 | 1,216 | 1,064 | 1,095 |
| Single-Family Sales | 4,370 | 4,430 | 4,760 | 4.3 | 4,573 | 4,341 | 4,960 |
| Median Price, Total, $ (NSA) | 165,100 | 164,900 | 170,500 | -1.8 | 172,742 | 197,233 | 216,633 |
by Tom Moeller
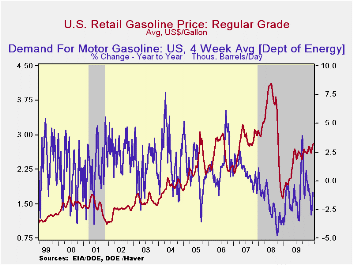 The pump price for regular gasoline inched
up another three cents last week to $2.82 per gallon, up by
three-quarters since December of 2008. Yesterday, the spot market price
of $2.15 for a gallon of regular gasoline was roughly unchanged from
last week's average. The figures are reported by the U.S. Department of
Energy and can be found in Haver's WEEKLY & DAILY databases.
The pump price for regular gasoline inched
up another three cents last week to $2.82 per gallon, up by
three-quarters since December of 2008. Yesterday, the spot market price
of $2.15 for a gallon of regular gasoline was roughly unchanged from
last week's average. The figures are reported by the U.S. Department of
Energy and can be found in Haver's WEEKLY & DAILY databases.
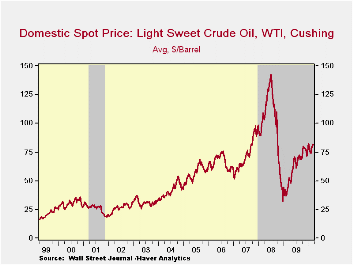
The price for a barrel of light sweet crude (WTI) eased slightly last week to $81.46 and remained down slightly from the early-January high of $82.59. Prices have risen from $71.53 early this past December and are more than double the December 2008 low of $32.37. Yesterday, the spot price held roughly steady with last week's average at $81.25.
Demand for gasoline fell 1.0% last week versus one year ago. That decline compared to a 3.9% increase at the beginning of October. The demand for residual fuel oil spiked 16.7% with lower temperatures, however, distillate demand fell 2.3% y/y. Inventories of crude oil and petroleum products slipped again in early-March and were down slightly from one year ago.
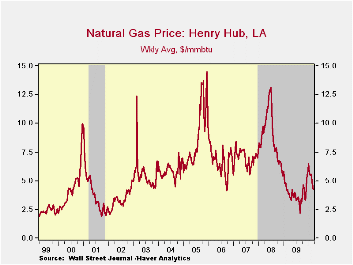
U.S. natural gas prices fell further last week to an average $4.22 per mmbtu (+10.4% y/y). Prices reached a high of $6.50 early in January. Nevertheless, prices remained nearly double the September low.
The energy price data can be found in Haver's WEEKLY database while the daily figures are in DAILY. The gasoline demand figures are in OILWKLY.
| Weekly Prices | 3/22/10 | 03/15/10 | 03/08/10 | Y/Y | 2009 | 2008 | 2007 |
|---|---|---|---|---|---|---|---|
| Retail Regular Gasoline ($ per Gallon, Regular) | 2.82 | 2.79 | 2.75 | 43.7% | 2.35 | 3.25 | 2.80 |
| Light Sweet Crude Oil, WTI ($ per bbl.) | 81.46 | 81.76 | 80.19 | 64.7% | 61.39 | 100.16 | 72.25 |
by Louise Curley March 23, 2010
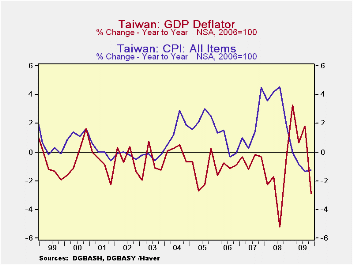
After some ten months of deflation measured by the year to year decline in the consumer price index, Taiwan has now experienced two months of inflation. In January the year to year change in the consumer price index was a small positive of 0.26%, and in February, the change was more significant at 2.35%. The deflation in the consumer price index was due largely to price declines in the prices of gas and oil. Now that the prices of fuels have resumed rising, the inflation is beginning to pick up.
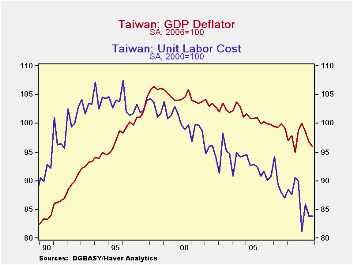
There are however, other measures of deflation/inflation--the GDP deflator for one. Year to year changes in the quarterly GDP deflator are shown in the first chart compared with the year to year changes in the quarterly consumer price index. Measured by changes in the deflator, it appears that deflation has been deeper and more persistent than that indicated by the consumer price index. The changes in the deflator are due to other changes in the economy besides commodity price changes. The most important of these "other" changes is the change in unit labor costs. The trend of unit labor costs has been negative since the mid-nineties, as can be seen in the second chart, which shows the deflator and the index of unit labor costs since 1990.
An end to Taiwan's deflation is likely to depend more on what happens to unit labor costs than what happens to commodity prices. Unit labor costs, F528ECU@EMERGEPR, Consumer Price Index, N528PC@EMERGEPR and GDP Deflator, F528NGPJ@EMERGEPR are all found in the Haver Data Base EMERGEPR.
| Feb 10 | Jan 10 | Dec 09 | Nov 09 | Oct 09 | Sep 09 | Aug 09 | Jul 09 | |
|---|---|---|---|---|---|---|---|---|
| Y/Y % Change in CPI | 2.35 | 0.26 | -0.25 | -1.62 | -1.89 | -0.88 | -0.82 | -2.33 |
| Q4/09 | Q3 09 | Q2 09 | Q1 09 | Q4 08 | Q3 08 | Q2 08 | Q1 08 | |
| Y/Y % Change in CPI | -1.26 | -1.35 | -085 | -0.01 | 1.87 | 4.52 | 4.19 | 3.58 |
| Y/Y % Change in GDP Deflator | -2.87 | 1.80 | 0.65 | 3.28 | -0.35 | -524 | -171 | -2.26 |
| GDP Deflator (2000=100) | 91.07 | 92.60 | 94.21 | 95.54 | 94.46 | -0.67 | 93.49 | 92.65 |
| Unit Labor Cost (2000=100) | 83.92 | 83.89 | 85.97 | 81.16 | 89.91 | 90.53 | 87.61 | 88.51 |
by Louise Curley March 23, 2010
After some ten months of deflation measured by the year to year decline in the consumer price index, Taiwan has now experienced two months of inflation. In January the year to year change in the consumer price index was a small positive of 0.26%, and in February, the change was more significant at 2.35%. The deflation in the consumer price index was due largely to price declines in the prices of gas and oil. Now that the prices of fuels have resumed rising, the inflation is beginning to pick up.
There are however, other measures of deflation/inflation--the GDP deflator for one. Year to year changes in the quarterly GDP deflator are shown in the first chart compared with the year to year changes in the quarterly consumer price index. Measured by changes in the deflator, it appears that deflation has been deeper and more persistent than that indicated by the consumer price index. The changes in the deflator are due to other changes in the economy besides commodity price changes. The most important of these "other" changes is the change in unit labor costs. The trend of unit labor costs has been negative since the mid-nineties, as can be seen in the second chart, which shows the deflator and the index of unit labor costs since 1990.
An end to Taiwan's deflation is likely to depend more on what happens to unit labor costs than what happens to commodity prices. Unit labor costs, F528ECU@EMERGEPR, Consumer Price Index, N528PC@EMERGEPR and GDP Deflator, F528NGPJ@EMERGEPR are all found in the Haver Data Base EMERGEPR.
| Feb 10 | Jan 10 | Dec 09 | Nov 09 | Oct 09 | Sep 09 | Aug 09 | Jul 09 | |
|---|---|---|---|---|---|---|---|---|
| Y/Y % Change in CPI | 2.35 | 0.26 | -0.25 | -1.62 | -1.89 | -0.88 | -0.82 | -2.33 |
| Q4/09 | Q3 09 | Q2 09 | Q1 09 | Q4 08 | Q3 08 | Q2 08 | Q1 08 | |
| Y/Y % Change in CPI | -1.26 | -1.35 | -085 | -0.01 | 1.87 | 4.52 | 4.19 | 3.58 |
| Y/Y % Change in GDP Deflator | -2.87 | 1.80 | 0.65 | 3.28 | -0.35 | -524 | -171 | -2.26 |
| GDP Deflator (2000=100) | 91.07 | 92.60 | 94.21 | 95.54 | 94.46 | -0.67 | 93.49 | 92.65 |
| Unit Labor Cost (2000=100) | 83.92 | 83.89 | 85.97 | 81.16 | 89.91 | 90.53 | 87.61 | 88.51 |
by Robert Brusca March 23, 2010
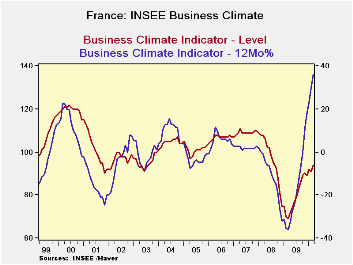
France’s business climate indicator complied by Insee, rose to 94 in March from 91 in February. This is its best standing since August of 2008. Still it is not a good level. The climate indicator is only in the 47th percentile of its range values over the past two decades. If we place the current reading in a queue, instead of just positioning it between its highs and lows, it stands in the lower 30% of its two-decade queue of monthly values.
The momentum of the index is still strong as the Yr/Yr percentage gain reading tells us. But the level is still not at an acceptable point. At the same time President Sarkozy has implemented reforms that in these hard times are unpopular. He has lost a key regional election. On Tuesday a two-day national strike called by public sector works deals another blow to the Sarkozy government. About half the trains were running on Paris commuter lines on Tuesday morning, while nearly two-thirds of national high-speed TGV services were operating, according to a French news agency. National rail operator SNCF said services would be uneven until early on Wednesday. Teachers are protesting over job cuts and joining the demonstration, along with other public sector workers complaining about conditions at work and their lack of spending power.
Despite some sharp improvement in economic conditions the huge fiscal help offered by the government has reached its limits. Attempts to pull back and inject fiscal prudence are not being well-accepted in France.
The economic indicators say that Sarkozy’s management of the economy has helped put it on a continuing expansion. But the political airs tell us that that it is still not enough improvement for the French people who do not want and further adjustment pace on their back. France is at an impasse of sorts.
So this is the newest wrinkle in Euroland. But there is anther re-wrinkle to the ongoing Greek crisis and Germany’s opposition to giving Greece help within the zone and its opposition to Greece being helped by the IMF. It is hard to understand what the German’s have to gain by dogging a beleaguered Greece in this way. But the Greek problem, once thought to be fading to the background is now again a front line euro story and it is once again a reason for some new euro-weakness.
| INSEE Industry Survey | ||||||||||
|---|---|---|---|---|---|---|---|---|---|---|
| Since Jan 1990 | Since Jan 1990 | |||||||||
| Mar 10 |
Feb 10 |
Jan 10 |
Dec 09 |
Percentile | Rank | Max | Min | Range | Mean | |
| Climate | 94 | 91 | 92 | 89 | 47.2 | 170 | 122 | 69 | 53 | 100 |
| Production | ||||||||||
| Recent Trend | -6 | -4 | -4 | -10 | 57.6 | 117 | 44 | -74 | 118 | -8 |
| Likely trend | 4 | -3 | -3 | -5 | 62.9 | 134 | 30 | -40 | 70 | 5 |
| Orders/Demand | ||||||||||
| Orders&Demand | -45 | -48 | -46 | -52 | 22.2 | 215 | 25 | -65 | 90 | -17 |
| FgnOrders&Demand | -38 | -46 | -45 | -54 | 32.4 | 211 | 31 | -71 | 102 | -13 |
| Prices | ||||||||||
| Likely Sales Price Trend | -6 | -8 | -8 | -18 | 36.2 | 166 | 24 | -23 | 47 | 0 |

Tom Moeller
AuthorMore in Author Profile »Prior to joining Haver Analytics in 2000, Mr. Moeller worked as the Economist at Chancellor Capital Management from 1985 to 1999. There, he developed comprehensive economic forecasts and interpreted economic data for equity and fixed income portfolio managers. Also at Chancellor, Mr. Moeller worked as an equity analyst and was responsible for researching and rating companies in the economically sensitive automobile and housing industries for investment in Chancellor’s equity portfolio. Prior to joining Chancellor, Mr. Moeller was an Economist at Citibank from 1979 to 1984. He also analyzed pricing behavior in the metals industry for the Council on Wage and Price Stability in Washington, D.C. In 1999, Mr. Moeller received the award for most accurate forecast from the Forecasters' Club of New York. From 1990 to 1992 he was President of the New York Association for Business Economists. Mr. Moeller earned an M.B.A. in Finance from Fordham University, where he graduated in 1987. He holds a Bachelor of Arts in Economics from George Washington University.
More Economy in Brief


