 Global| Sep 24 2008
U.S. Existing Home Sales & Prices Fell
by:Tom Moeller
|in:Economy in Brief
Summary
The level of existing homes during August fell 2.2% m/m to 4.910 million. The figure, reported by the National Association of Realtors, followed a 3.5% increase during July which was revised up modestly. The figure about matched [...]
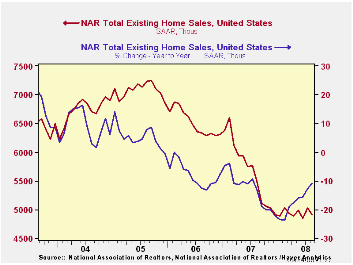
The level of existing homes during August fell 2.2% m/m to 4.910 million. The figure, reported by the National Association of Realtors, followed a 3.5% increase during July which was revised up modestly. The figure about matched Consensus expectations for a selling rate of 4.94M homes. Total sales include sales of condos and co-ops.
Sales of existing single-family homes fell a lesser 1.4% and have moved sideways since last Fall. These sales have a longer history than the total and they were still near their lowest level since early-1998.
By region, home sales in the Northeast reversed all of their July improvement with a 6.6% (-15.0% y/y) decline. Sales out West also fell 5.3% (+4.9% y/y) and reversed the July increase. Working the other way, sales in the Midwest rose 0.9% (-12.3% y/y) and in the South sales also reversed the July downtick and inched up 0.5% (-15.1% y/y).
Median home prices fell 3.4% last month after a downwardly revised 2.2% drop during July.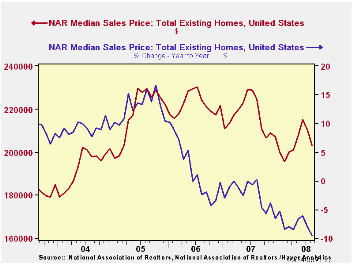
The number of unsold homes (condos & single-family) on the market fell 7.0% from July (-2.9% y/y). At the current sales rate the inventory fell slightly to a 10.4 months supply which is near the record high for this series. For single-family homes, however, the inventory fell a bit more to a 10.0 months supply at the current sales rate. That was down from an 11.0 months supply in June.
Why Do Chinese Households Save So Much? from the Federal Reserve Bank of St. Louis is available here.
| Existing Home Sales (Thous) | August | y/y % | July | August '07 | 2007 | 2006 | 2005 |
|---|---|---|---|---|---|---|---|
| Total | 4,910 | -10.7 | 5,020 | 5,500 | 5,672 | 6,508 | 7,076 |
| Northeast | 850 | -15.0 | 910 | 1,000 | 1,008 | 1,090 | 1,168 |
| Midwest | 1,140 | -12.3 | 1,130 | 1,300 | 1,331 | 1,491 | 1,589 |
| South | 1,860 | -15.1 | 1,850 | 2,190 | 2,240 | 2,576 | 2,704 |
| West | 1,070 | 4.9 | 1,130 | 1,020 | 1,093 | 1,353 | 1,617 |
| Single-Family | 4,350 | -9.6 | 4,410 | 4,810 | 4,958 | 5,703 | 6,181 |
| Median Price, Total, $ | 203,100 | -9.5 | 210,300 | 224,400 | 216,617 | 222,000 | 218,217 |

Tom Moeller
AuthorMore in Author Profile »Prior to joining Haver Analytics in 2000, Mr. Moeller worked as the Economist at Chancellor Capital Management from 1985 to 1999. There, he developed comprehensive economic forecasts and interpreted economic data for equity and fixed income portfolio managers. Also at Chancellor, Mr. Moeller worked as an equity analyst and was responsible for researching and rating companies in the economically sensitive automobile and housing industries for investment in Chancellor’s equity portfolio. Prior to joining Chancellor, Mr. Moeller was an Economist at Citibank from 1979 to 1984. He also analyzed pricing behavior in the metals industry for the Council on Wage and Price Stability in Washington, D.C. In 1999, Mr. Moeller received the award for most accurate forecast from the Forecasters' Club of New York. From 1990 to 1992 he was President of the New York Association for Business Economists. Mr. Moeller earned an M.B.A. in Finance from Fordham University, where he graduated in 1987. He holds a Bachelor of Arts in Economics from George Washington University.
More Economy in Brief


