 Global| Apr 22 2008
U.S. Existing Home Sales Fell, Prices Rose
by:Tom Moeller
|in:Economy in Brief
Summary
According to the National Association of Realtors, March sales of existing home sales fell 2.0% m/m to 4.930M. The drop reversed most of February's unrevised 2.9% increase and it was as expected. The downward momentum behind last [...]
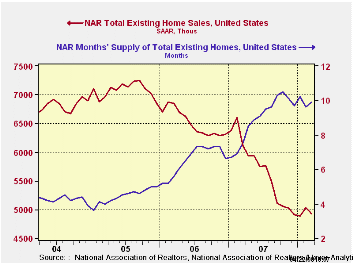
According to the National Association of Realtors, March sales of existing home sales fell 2.0% m/m to 4.930M. The drop reversed most of February's unrevised 2.9% increase and it was as expected.
The downward momentum behind last year's sales declines continued to look like it's flattened out. During the last three months sales were about even with the yearend '07 level.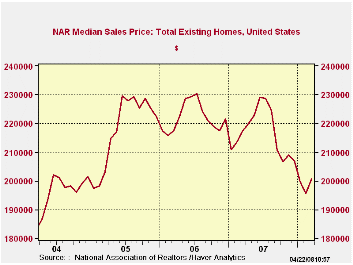
Despite a 2.6% one month rise in median home prices, the trend still is lower. The gain followed three consecutive months of decline and the three month average of home prices fell to a new cycle low, 12.6% below the high last August.
Sales of existing single family homes in March fell 2.7% to 4.350M and reversed all of February's gain.
By region, home sales in the Midwest fell a hard 6.5% (-15.9% y/y) while sales in the South also fell by 3.5% (-20.0% y/y). In the Northeast sales rose for the second consecutive month following three months of decline. Sales in the West rose a modest 2.2% after two months of decline.
The number of unsold homes on the market rose a modest 1.0% (6.6% y/y). At the current sales rate the inventory still amounts to a 9.9 months supply which is barely down from last year's peak. For single family homes there is a 9.5 months supply at the current sales rate and for condos and co-ops there is a 12.8 months supply.
New Monetary Policy Tools? from the Federal Reserve Bank of St. Louis can be found here.
| Existing Single Family Home Sales (Thous) |
March | y/y % | February | March '07 | 2007 | 2006 | 2005 |
|---|---|---|---|---|---|---|---|
| Total | 4,930 | -19.3 | 5,030 | 6,110 | 5,672 | 6,508 | 7,076 |
| Northeast | 910 | -18.8 | 890 | 1,120 | 1,008 | 1,090 | 1,168 |
| Midwest | 1,160 | -15.9 | 1,240 | 1,380 | 1,331 | 1,491 | 1,589 |
| South | 1,920 | -20.0 | 1,990 | 2,400 | 2,240 | 2,576 | 2,704 |
| West | 940 | -22.3 | 920 | 1,210 | 1,093 | 1,353 | 1,617 |
| Single-Family | 4,350 | -18.4 | 4,470 | 5,330 | 4,958 | 5,703 | 6,181 |
| Median Price, Total, $ | 200,700 | -7.7 | 195,600 | 217,400 | 216,617 | 222,000 | 218,217 |

Tom Moeller
AuthorMore in Author Profile »Prior to joining Haver Analytics in 2000, Mr. Moeller worked as the Economist at Chancellor Capital Management from 1985 to 1999. There, he developed comprehensive economic forecasts and interpreted economic data for equity and fixed income portfolio managers. Also at Chancellor, Mr. Moeller worked as an equity analyst and was responsible for researching and rating companies in the economically sensitive automobile and housing industries for investment in Chancellor’s equity portfolio. Prior to joining Chancellor, Mr. Moeller was an Economist at Citibank from 1979 to 1984. He also analyzed pricing behavior in the metals industry for the Council on Wage and Price Stability in Washington, D.C. In 1999, Mr. Moeller received the award for most accurate forecast from the Forecasters' Club of New York. From 1990 to 1992 he was President of the New York Association for Business Economists. Mr. Moeller earned an M.B.A. in Finance from Fordham University, where he graduated in 1987. He holds a Bachelor of Arts in Economics from George Washington University.
More Economy in Brief


