 Global| Jan 25 2006
U.S. Existing Home Sales Fell A Third Month
by:Tom Moeller
|in:Economy in Brief
Summary
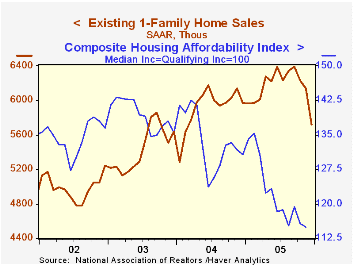
According to the National Association of Realtors, total existing home sales fell 5.7% m/m to 6.600M (AR) in December from November which was revised down slightly. Consensus expectations for sales last month had been for a lesser [...]
The latest release from the National Association of Realtors is available here.
| Existing Home Sales (000, AR) | Dec | Nov | Y/Y | 2005 | 2004 | 2003 |
|---|---|---|---|---|---|---|
| Total Home Sales | 6,600 | 7,000 | -3.1% | 7,049 | 6,723 | 6,170 |
| Single Family Home Sales | 5,720 | 6,140 | -4.2% | 6,157 | 5,913 | 5,441 |
| Single Family Median Home Price ($,000) | $209.3 | $213.1 | 10.8% | $206.3 | $182.8 | $169.1 |
by Tom Moeller January 25, 2006
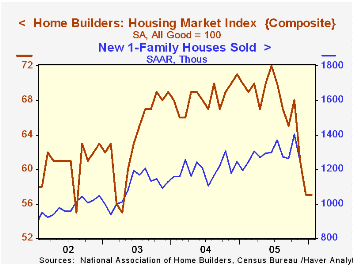
The National Association of Home Builders' (NAHB) Composite Housing Market Index remained stable, but depressed, in January at 57; the lowest level since April 2003.
During the last twenty years the y/y change in the annual composite index has had an 85% correlation with the change in single family housing starts and there has been a 75% correlation between the current sales index and new single family home sales.
The January index for current sales of single family homes fell further to 62, down 20% from the January '05 level of 77 though the index for sales in six months remained for the third month at 65versus an average of 75 during all of last year
Traffic of prospective home buyers remained quite depressed at an index level of 40, the lowest level since April 2003.
The NAHB index is a diffusion index based on a survey of builders. Readings above 50 signal that more builders view conditions as good than poor.
Visit the National Association of Home Builders.
| Nat'l Association of Home Builders | Jan | Dec | Jan '05 | 2005 | 2004 | 2003 |
|---|---|---|---|---|---|---|
| Composite Housing Market Index | 57 | 57 | 70 | 67 | 68 | 64 |
by Tom Moeller January 25, 2006
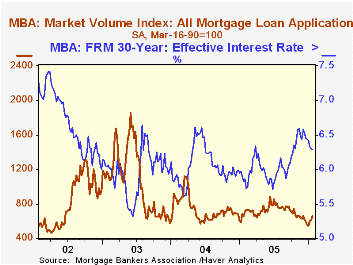
The total number of mortgage applications rose 7.7% last week for the third consecutive weekly gain. For the month of January mortgage applications are 5.1% higher than during December.
The effective interest rate on a conventional 30-year mortgage dipped to 6.29%, down for the seventh straight week versus an average 6.48% in December and a high November average of 6.52%. The effective rate on a 15-year mortgage increased slightly to 5.95%. The interest rates on 15 and 30 year mortgages are closely correlated (>90%) with the rate on 10 year Treasury securities.
Higher applications to refinance again led the week's rise with a 7.8% increase which lifted the level of refis this month 15.8% above December.
Purchase applications recovered all of the prior week's decline with a 6.7% increase that pulled purchase applications in January 0.6% ahead of the December average.
During the last ten years there has been a 50% correlation between the y/y change in purchase applications and the change in new plus existing single family home sales
The Mortgage Bankers Association surveys between 20 to 35 of the top lenders in the U.S. housing industry to derive its refinance, purchase and market indexes. The weekly survey accounts for more than 40% of all applications processed each week by mortgage lenders. Visit the Mortgage Bankers Association site here.
| MBA Mortgage Applications (3/16/90=100) | 01/20/06 | 01/13/06 | Y/Y | 2005 | 2004 | 2003 |
|---|---|---|---|---|---|---|
| Total Market Index | 660.5 | 613.3 | 0.4% | 708.6 | 735.1 | 1,067.9 |
| Purchase | 473.7 | 443.9 | 7.9% | 470.9 | 454.5 | 395.1 |
| Refinancing | 1,773.9 | 1,645.2 | -8.2% | 2,092.3 | 2,366.8 | 4,981.8 |
by Tom Moeller January 25, 2006
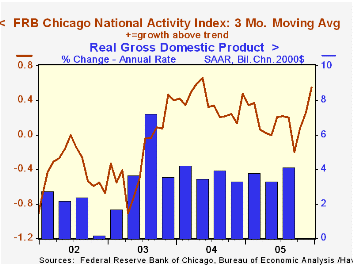
The National Activity Index (CFNAI) compiled by the Federal Reserve Bank of Chicago fell sharply in December to 0.08 from 0.59 in November but the three-month moving average of the CFNAI rose to 0.55, the highest level since April 2004.
A zero value of the CFNAI indicates that the economy is expanding at its historical trend rate of growth.
Recent movements in the index have been exaggerated due to the damaging economic effects of last year's hurricanes.
The CFNAI is a weighted average of 85 indicators of economic activity. The indicators reflect activity in the following categories: production and income, the labor market, personal consumption and housing, manufacturing and trade sales, and inventories & orders.
During the last twenty years there has been a 74% correlation between the level of the CFNAI and q/q growth in real GDP.
The latest CFNAI report is available here.
Ill Winds Can't Blow U.S. Economy Off Course from the Federal Reserve Bank of Atlanta can be found here.
| Chicago Fed | Dec | Nov | Dec '04 | 2005 | 2004 | 2003 |
|---|---|---|---|---|---|---|
| CFNAI | 0.08 | 0.59 | 0.72 | 0.16 | 0.38 | -0.11 |
by Tom Moeller January 25, 2006
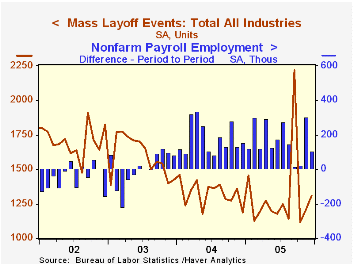
Mass layoffs jumped 8.5% in December following a like rise during November. The latest was the highest level since January of 2005. For the year, the number of mass layoffs fell by 1.4%.
During the last ten years there has been a (negative) 87% correlation between the three month average level of layoff announcements and the y/y change in payroll employment.
The number of persons affected in December by mass layoffs jumped 23.8% m/m. During the latest two months layoffs in the construction industry have soared. Elsewhere by industry, the number of factory sector layoff announcements rose 10.1% (49.9% y/y) in December due to a tripling in transportation and in retail the number of affected persons doubled m/m (34.2% y/y).
The Mass Layoff Statistics (MLS) program collects reports on mass layoff actions that result in workers being separated from their jobs. Monthly mass layoff numbers are from establishments which have at least 50 initial claims for unemployment insurance (UI) filed against them during a 5-week period
| Mass Layoffs | Dec | Nov | Y/Y | 2005 | 2004 | 2003 |
|---|---|---|---|---|---|---|
| All US Industries (# Events, SA) | 1,308 | 1,205 | 10.1% | 15,662 | 15,877 | 19,155 |
| Total (# Persons, SA) | 149,565 | 120,783 | 24.0% | 1,714,433 | 1,589,446 | 1,936,463 |
by Carol Stone January 25, 2006
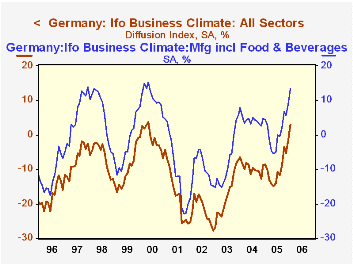
While business in the UK appears to be flagging, as reported here yesterday by Louise Curley, on the Continent, affairs look more favorable. Ifo, an independent research institute in Germany, relates today that its Business Climate Index for January moved up to +3.0 from -1.7 in December. This was only the 21st positive monthly reading in just over 15 years of survey data. The two components, the Business Situation and Business Expectations also improved, with Expectations at +10.8 from +2.6 last month. The Situation measure, a gauge of current conditions, remained negative, but less so, at -4.5 from -6.0 in December. Among types of businesses, manufacturers, construction companies and retailers participated in the advance. Wholesalers' sentiments eroded a bit, from -0.8 to -2.1, but these were still the best two readings in this sector since May 2000.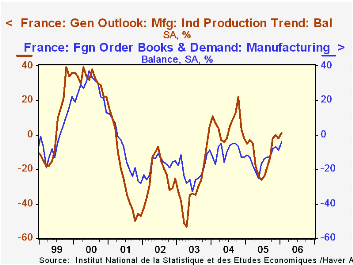
In a similar survey covering manufacturers and other industrial firms in France, sentiments changed little in the month, but their modest move pushed their diffusion index to +1, the first positive reading since November 2004. Conducted by INSEE, the French Government statistical office, this monthly business survey, measuring the outlook for the trend in industrial production, is much more variable than the Ifo data in Germany. So less significance can be taken from this latest swing in the French figures. Even so, French managers are considerably more sanguine about manufacturing prospects than they were through much of 2005. Foreign orders look to be a major ingredient.
| Indexes, 2000=100, SA | Jan 2006 | Dec 2005 | Nov 2005 | Year Ago | 2005 | 2004 | 2003 |
|---|---|---|---|---|---|---|---|
| Germany: Ifo Business Climate | 102.0 | 99.6 | 97.8 | 96.2 | 95.6 | 95.7 | 91.7 |
| Diffusion % | +3.0 | -1.7 | -5.3 | -8.6 | -9.7 | -9.6 | -17.5 |
| Business Situation | 100.4 | 99.6 | 97.8 | 95.1 | 95.4 | 94.0 | 88.3 |
| Diffusion % | -4.5 | -6.0 | -9.5 | -14.7 | -14.2 | -17.0 | -27.9 |
| Business Expectations | 103.6 | 99.6 | 97.8 | 97.2 | 95.8 | 97.4 | 95.1 |
| Diffusion % | +10.8 | +2.6 | -1.1 | -2.2 | -5.1 | -1.8 | -6.5 |
| France: INSEE Business Survey* | 1 | -2 | 0 | -5 | -12 | +5 | -29 |
by Carol Stone January 25, 2006
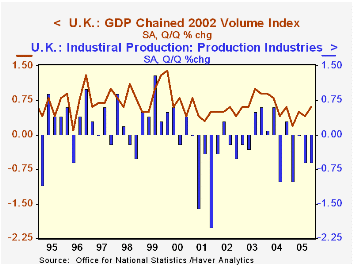
The "preliminary" estimate of GDP in the UK shows an improvement in growth for Q4, to 0.6%, from 0.4% in Q3. This result might surprise observers in light of several reports, the latest only yesterday, of deteriorating business sentiment in that economy. The answer appears to be a mixed one. Output at the so-called "production" industries, that is, manufacturing, mining and utilities, shrank in the quarter by 0.6%. The overall gain in GDP came from a notable pickup in the service sector to 0.9%, its strongest performance since the spring of 2004. Further, even among the production industries, the erratic mining industry whipped around from a steep -7.7% in Q3 to +1.3% in Q4. Several service industries also showed growth spurts of over 1% after more moderated gains in previous quarters. So the improvement in the total GDP figure in Q4 may be more transitory than a sign of a firming trend.
| UK GDP SA, % Changes | Q4 2005 "Prel" | Q3 2005 | Q2 2005 | Year/Year | 2005 | 2004 | 2003 | 2002 |
|---|---|---|---|---|---|---|---|---|
| GDP | 0.6 | 0.4 | 0.5 | 1.7 | 1.8 | 3.2 | 2.5 | 2.0 |
| Manufacturing | -0.8 | 0.3 | -0.2 | -1.6 | -0.6 | 1.9 | 0.1 | -3.1 |
| Mining incl Oil Extraction | 1.3 | -7.7 | 0.2 | -7.1 | -8.4 | -8.1 | -5.1 | -0.3 |
| Electricity, Gas & Water Supply | -0.2 | -1.0 | 1.0 | -1.8 | -1.6 | 2.1 | 1.2 | -0.5 |
| Services | 0.9 | 0.7 | 0.6 | 2.9 | 2.6 | 3.6 | 2.7 | 2.7 |

Tom Moeller
AuthorMore in Author Profile »Prior to joining Haver Analytics in 2000, Mr. Moeller worked as the Economist at Chancellor Capital Management from 1985 to 1999. There, he developed comprehensive economic forecasts and interpreted economic data for equity and fixed income portfolio managers. Also at Chancellor, Mr. Moeller worked as an equity analyst and was responsible for researching and rating companies in the economically sensitive automobile and housing industries for investment in Chancellor’s equity portfolio. Prior to joining Chancellor, Mr. Moeller was an Economist at Citibank from 1979 to 1984. He also analyzed pricing behavior in the metals industry for the Council on Wage and Price Stability in Washington, D.C. In 1999, Mr. Moeller received the award for most accurate forecast from the Forecasters' Club of New York. From 1990 to 1992 he was President of the New York Association for Business Economists. Mr. Moeller earned an M.B.A. in Finance from Fordham University, where he graduated in 1987. He holds a Bachelor of Arts in Economics from George Washington University.
More Economy in Brief


