 Global| Jun 27 2006
U.S. Existing Home Sales Decline As Expected
by:Tom Moeller
|in:Economy in Brief
Summary
Total existing home sales fell 1.2% during May to 6.670M following a little revised 2.2% decline during April. Consensus expectations had been for sales of 6.62M and the figures were reported by the National Association of Realtors. [...]
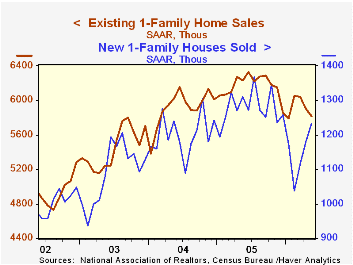
 Sales were weakest last month in the Northeast which posted a 4.8% drop (-5.9% y/y) and in the Midwest where they fell 4.3% (-5.6% y/y). In the South (-2.8% y/y) and in the West (-14.1% y/y), May sales were unchanged from the prior month.
The median price of an existing single-family home rose 3.2% (6.4% y/y). The price figures are not seasonally adjusted.
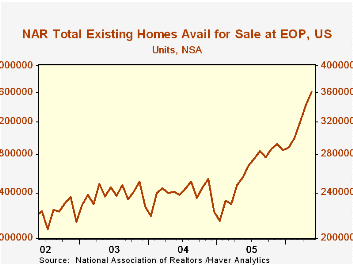
The inventory of unsold existing homes rose 5.5% and was up 41.0% from one year earlier. The supply of unsold single family homes was up 36.3% y/y and the supply of condos & coops for sale was up 73.0%.
Sales were weakest last month in the Northeast which posted a 4.8% drop (-5.9% y/y) and in the Midwest where they fell 4.3% (-5.6% y/y). In the South (-2.8% y/y) and in the West (-14.1% y/y), May sales were unchanged from the prior month.
The median price of an existing single-family home rose 3.2% (6.4% y/y). The price figures are not seasonally adjusted.
The inventory of unsold existing homes rose 5.5% and was up 41.0% from one year earlier. The supply of unsold single family homes was up 36.3% y/y and the supply of condos & coops for sale was up 73.0%.
The latest release from the National Association of Realtors is available here.
| Existing Home Sales (000, AR) | May | April | Y/Y | 2005 | 2004 | 2003 |
|---|---|---|---|---|---|---|
| Total Home Sales | 6,670 | 6,750 | -6.6% | 7,064 | 6,722 | 6,176 |
| Single Family Home Sales | 5,820 | 5,910 | -6.6% | 6,170 | 5,912 | 5,443 |
| Single Family Median Home Price (000) | $229.7 | $222.6 | 6.4% | $206.3 | $182.8 | $169.1 |
by Tom Moeller June 27, 2006
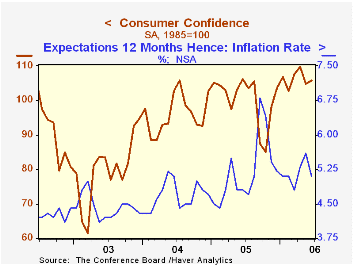
Consumer confidence as reported by the Conference Board improved 1.0% in June to 105.7. The rise recovered a piece of the 4.6% May decline that was revised slightly shallower. It contrasted to Consensus expectations for a further decline to 103.5 and compared to a 4.2% rise in the University of Michigan's June Index of Consumer Sentiment.
During the last twenty years there has been a 52% correlation between the level of consumer confidence and the y/y change in real consumer spending. The correlation rose to 66% during the last ten years.
Consumers' assessment of the present situation fell for a second month and posted a 1.0% decline (+9.9% y/y). The percentage of respondents who viewed business conditions as good (26.8%) fell for a second month and the percentage that viewed jobs as hard to get (19.9%) reversed the prior month's rise.
The index of consumers' expectations rose a modest 2.9% (-9.1% y/y) and recovered just part of the May decline. Expectations for business conditions in six months improved slightly as did expectations that the number of jobs would rise. Expectations for the inflation rate in twelve months slipped to 5.1% from 5.6% expected in May.
The Conference Board’s survey isconducted by a mailed questionnaire to 5,000 households and about 3,500 typically respond.
| Conference Board | June | May | Y/Y | 2005 | 2004 | 2003 |
|---|---|---|---|---|---|---|
| Consumer Confidence | 105.7 | 104.7 | -0.5% | 100.3 | 96.1 | 79.8 |
by Tom Moeller June 27, 2006
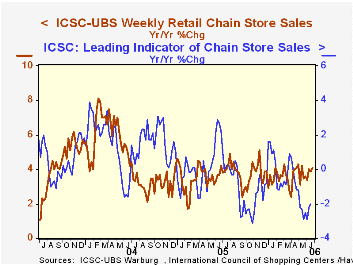
The International Council of Shopping Centers (ICSC)-UBS reported that chain store sales fell 0.4% last week after having been unchanged the prior period.
Sales in June are 0.2% below the May average which fell 0.4% from April. During the last ten years there has been a 47% correlation between the y/y change in chain store sales and the change in nonauto retail sales less gasoline.The ICSC-UBS retail chain-store sales index is constructed using the same-store sales (stores open for one year) reported by 78 stores of seven retailers: Dayton Hudson, Federated, Kmart, May, J.C. Penney, Sears and Wal-Mart.
The leading indicator of chain store sales from ICSC-UBS fell 0.3% (-2.0% y/y) during the latest period after three consecutive weeks of increase.
Parsing Recent Inflation Data from the Federal Reserve Bank of Dallas can be found here
| ICSC-UBS (SA, 1977=100) | 06/24/06 | 06/17/06 | Y/Y | 2005 | 2004 | 2003 |
|---|---|---|---|---|---|---|
| Total Weekly Chain Store Sales | 471.6 | 473.6 | 4.1% | 3.6% | 4.7% | 2.9% |
by Louise Curley June 27, 2006
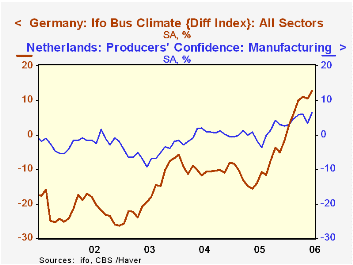
Germany, Italy and the Netherlands reported increased business confidence today. We noted yesterday that confidence in Belgium had also increased. France is the only Euro Zone country that, so far, has seen a decline in business confidence.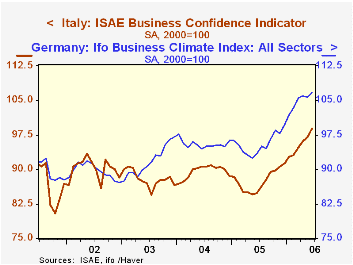
The German IFO measure of business confidence rose 1.0% from 105.7 to 106.8 (2000=100) in June, the highest level since February, 1991. In terms of the diffusion index the excess of optimists over pessimists rose 2.3 percentage points from 10.4% in May to 12.7% in June. In the Netherlands, where business confidence is measured by the excess of optimists over pessimists, the percent balance rose 3.1 percentage points from 3.3% to 6.4%. The first chart compares the percent balances indicators for Germany and the Netherlands. Business confidence in Italy, which has been lower than that in Germany, rose by almost 2% in June from May to reach 98.9 (2000=100), the highest level since December, 2000. The second chart compares the indexes of business confidence in Germany and Italy.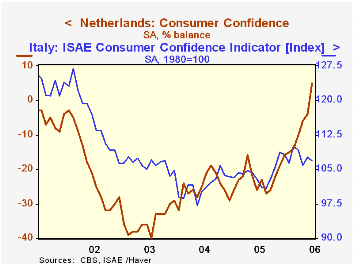
Italy and the Netherlands also reported on consumer confidence. The Italian consumer lost some confidence as the indicator of consumer confidence fell 0.7% from 107.1 (2000=100) in May to 106.8 in June. The Dutch consumer, on the contrary, became more optimistic in June as the optimists exceeded the pessimist by 5% in contrast to May when the pessimists exceeded the optimists by 4%. The third chart compares consumer confidence in Italy and in the Netherlands.
The rise in business confidence in these countries has occurred in spite of strength in the euro, continued high oil prices and the likelihood of a rise in the European Central Bank's main lending interest rate. It may be that the biggest threat to confidence is the possibility of greater than expected increases in ECB's lending rate. The rate is currently 2.75%, having risen by from the low 2% in three increments of 25 basis points in December of last year and in March and June of this year. In the past week six council members of the ECB have hinted that the bank may accelerate interest rate increases to combat inflationary pressures. And just today, in its Annual Report the Bank of International Settlements (BIS) called on central bankers to raise interest rates to combat these same global inflationary pressures.
| Confidence Measures | Jun 06 | May 06 | Jun 05 | M/M % | Y/Y % | 2005 | 2004 | 2003 |
|---|---|---|---|---|---|---|---|---|
| Germany Business Confidence | ||||||||
| Index (2000=100) | 106.8 | 105.7 | 93.3 | 1.04 | 14.47 | 95.5 | 95.5 | 91.8 |
| % Balance | 12.7 | 10.4 | -14.1 | 2.3* | 24.5* | -9.7 | -9.9 | -17.2 |
| Italy Business Confidence (2000=100) | 98.9 | 92.0 | 84.8 | 1.96 | 16.62 | 87.5 | 89.5 | 87.9 |
| Italy Consumer Confidence (2000=100) | 106.8 | 107.6 | 102.9 | -0.74 | 3.79 | 104.2 | 101.4 | 106.1 |
| Netherlands Business Confidence (% Balance | 6.4 | 3.3 | -1.7 | 3.1* | 8.1* | 0.6 | -0.1 | -5.6 |
| Netherlands Consumer Confidence (% Balance) | 5 | -4 | -26 | 9* | 31* | -22 | -25 | -35 |

Tom Moeller
AuthorMore in Author Profile »Prior to joining Haver Analytics in 2000, Mr. Moeller worked as the Economist at Chancellor Capital Management from 1985 to 1999. There, he developed comprehensive economic forecasts and interpreted economic data for equity and fixed income portfolio managers. Also at Chancellor, Mr. Moeller worked as an equity analyst and was responsible for researching and rating companies in the economically sensitive automobile and housing industries for investment in Chancellor’s equity portfolio. Prior to joining Chancellor, Mr. Moeller was an Economist at Citibank from 1979 to 1984. He also analyzed pricing behavior in the metals industry for the Council on Wage and Price Stability in Washington, D.C. In 1999, Mr. Moeller received the award for most accurate forecast from the Forecasters' Club of New York. From 1990 to 1992 he was President of the New York Association for Business Economists. Mr. Moeller earned an M.B.A. in Finance from Fordham University, where he graduated in 1987. He holds a Bachelor of Arts in Economics from George Washington University.
More Economy in Brief


