 Global| Jul 25 2005
U.S. Existing Home Prices & Sales Hot
by:Tom Moeller
|in:Economy in Brief
Summary
The median price of an existing single family home jumped 7.3% m/m in June to another record level, $218,600 (14.5% y/y). In just the first six month of this year prices have risen 15.7%. June sales of existing homes rose 2.7% to a [...]
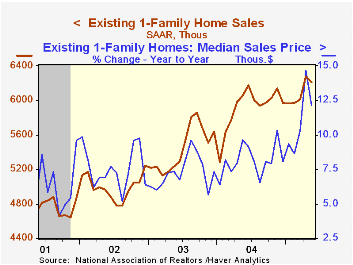
The median price of an existing single family home jumped 7.3% m/m in June to another record level, $218,600 (14.5% y/y). In just the first six month of this year prices have risen 15.7%.
June sales of existing homes rose 2.7% to a record 7.330M following a slight 0.6% dip in May that was revised shallower, according to the National Association of Realtors. Consensus expectations had been for sales of 7.13M.
The data reflect closings of home sales in earlier months.
Sales of single-family homes more than reversed the prior month's decline and rose 2.4% to 6.370M. Sales were strongest in the West and rose 5.4% (4.0% y/y) while sales in the Northeast rose 2.4% (3.6% y/y). In the Midwest sales rose 2.1% (-0.7% y/y) and in the South sales reversed the decline in May and rose 1.2% (6.0% y/y).
The latest release from the National Association of Realtors is available here.
The Minutes to the latest meeting of the Federal Open Market Committee can be found here.
| Existing Home Sales (000, AR) | June | May | Y/Y | 2004 | 2003 | 2002 |
|---|---|---|---|---|---|---|
| Total Home Sales | 7,330 | 7,140 | 4.4% | 6,723 | 6,170 | 5,653 |
| Single Family Home Sales | 6,370 | 6,220 | 3.2% | 5,913 | 5,441 | 4,995 |
by Louise Curley July 25, 2005
Mexico's trade deficit improved in June to -$270.6 million from -$579.7 million in May and was $526.6 million better than June, 2004. As a developing country, Mexico typically runs a trade deficit, which is offset by a capital inflow. The improvement in the balance was due to a 0.7% rise in exports and a 0.2% decline in imports.
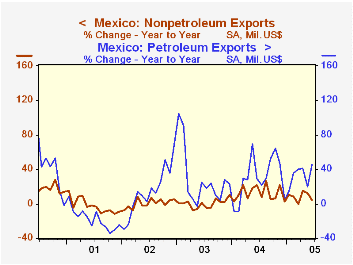
Exports were up 0.7% from May to June and were 13.0% above the year ago figure. Petroleum exports were up 11.0% for the month and 45.6% for the year. Higher prices, no doubt, accounted for much of the rises in petroleum. Non petroleum exports declined 1.6% in June, but were almost 5% above the year ago figures. The year-to-year changes in non petroleum exports have tended to be much smaller than the swings in the year-to-year changes in petroleum exports as shown in the first chart.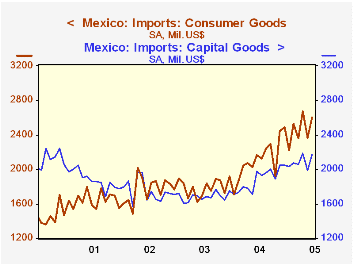
Imports decreased by 0.2% in June from May but were still 8.4% above June, 2004. The bulk of Mexico's imports consists of intermediate goods for further assembly and processing.These goods declined 4.1% from May to June, but were 3.3% above the June 2004. Over the past five years they have accounted for between 70% and 80% of total imports.The relative importance of capital and consumer goods has been changing in recent years with consumer goods rising in importance relative to capital goods, as shown in the second chart.
| Mexico Million US Dollars |
Jun 05 | May 05 | Jun 04 | M/M % | Y/Y % | 2004 | 2003 | 2002 |
|---|---|---|---|---|---|---|---|---|
| Exports | 17618.4 | 17503.1 | 15591.8 | 0.66 | 13.0 | 187475 | 164868 | 160899 |
| Petroleum | 2661.1 | 2397.0 | 1828.2 | 11.02 | 45.56 | 23656 | 18623 | 14853 |
| Non Petroleum | 15124.2 | 15368.1 | 14421.3 | -1.59 | 4.89 | 164404 | 146262 | 146278 |
| Imports | 17823.8 | 17851.2 | 16437.0 | -0.15 | 8.42 | 195825 | 170576 | 168482 |
| Consumer Goods | 2597.5 | 2366.2 | 2163.9 | 9.78 | 20.04 | 25402 | 21509 | 21178 |
| Capital Goods | 2174.5 | 1995.0 | 1977.6 | 9.55 | 9.96 | 22597 | 20205 | 20992 |
| Intermediate Goods | 13373.1 | 13940.1 | 12949.3 | -4.07 | 3.27 | 148813 | 128831 | 126508 |
| M/M chg | Y/Y chg | |||||||
| Trade Balance | -270.6 | -579.7 | -797.2 | 109.1 | 526.6 | -8724 | -5710 | -7538.6 |

Tom Moeller
AuthorMore in Author Profile »Prior to joining Haver Analytics in 2000, Mr. Moeller worked as the Economist at Chancellor Capital Management from 1985 to 1999. There, he developed comprehensive economic forecasts and interpreted economic data for equity and fixed income portfolio managers. Also at Chancellor, Mr. Moeller worked as an equity analyst and was responsible for researching and rating companies in the economically sensitive automobile and housing industries for investment in Chancellor’s equity portfolio. Prior to joining Chancellor, Mr. Moeller was an Economist at Citibank from 1979 to 1984. He also analyzed pricing behavior in the metals industry for the Council on Wage and Price Stability in Washington, D.C. In 1999, Mr. Moeller received the award for most accurate forecast from the Forecasters' Club of New York. From 1990 to 1992 he was President of the New York Association for Business Economists. Mr. Moeller earned an M.B.A. in Finance from Fordham University, where he graduated in 1987. He holds a Bachelor of Arts in Economics from George Washington University.
More Economy in Brief


