 Global| Jun 02 2006
U.S. Employment & Wage Growth Slowed
by:Tom Moeller
|in:Economy in Brief
Summary
Nonfarm payrolls rose a modest 75,000 during May, the weakest increase since last October. Moreover, job gains during the prior two months were revised down by a cumulative 37,000 while the May gain fell short of Consensus [...]
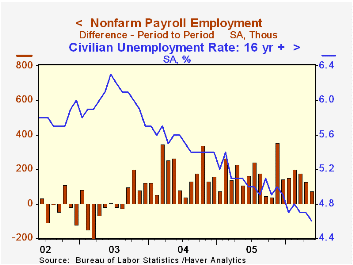
Nonfarm payrolls rose a modest 75,000 during May, the weakest increase since last October. Moreover, job gains during the prior two months were revised down by a cumulative 37,000 while the May gain fell short of Consensus expectations for a 175,000 rise.
Despite the weak jobs figures from the establishment survey, the household survey indicated a drop in the unemployment rate to 4.6% which compared to Consensus expectations for m/m stability at 4.7%. Employment rose 288,000 (1.7% y/y) and the labor force rose 180,000 (1.2% y/y).
Private sector payrolls grew 67,000 (1.6% y/y) during May while government employment rose 8,000 (0.7% y/y).
Private service-producing jobs rose 77,000 (1.6% y/y) last months after a downwardly revised 72,000 rise in April. For the twelve months ending March, these jobs were rising an average 131,000 per month. May jobs in retail trade fell 27,100 (-0.1% y/y) again reflecting broad based sector declines. Financial sector jobs rose 12,000 (2.7% y/y) and professional & business services employment rose 27,000 (2.7% y/y). Temporary help services jobs fell by 2,800 (+3.7% y/y), the fourth m/m decline this year. Jobs in education & health rose a firm 41,000 (2.4% y/y) but leisure & hospitality jobs increased just 4,000 (1.7% y/y).
Factory sector payrolls fell 14,000 after an unrevised 19,000 April increase. Employment in the motor vehicles & parts industries fell 9,700 (-1.7% y/y) and computer & electronics payrolls reversed all of the prior month's gain with a 4,6000 (+0.3% y/y) worker decline.
Construction employment increased just 1,000 (3.5% y/y) following monthly gains that averaged 22,000 during the prior year.
Growth in average hourly earnings moderated to 0.1% from an upwardly revised 0.6% rise during April. The slowdown exceeded Consensus expectations for a 0.3% increase. Private service-producing wages rose just 0.1% (4.2% y/y) following a 0.7% increase in April. Professional & business services wages were unchanged (5.7% y/y) after a 1.1% April jump while finance, insurance & real estate earnings fell 0.1% (4.6% y/y). Factory sector earnings were unchanged (1.6% y/y) after an upwardly revised 0.4% April gain.
| Employment | May | April | Y/Y | 2005 | 2004 | 2003 |
|---|---|---|---|---|---|---|
| Payroll Employment | 75,000 | 126,000 | 1.4% | 1.5% | 1.1% | -0.3% |
| Manufacturing | -14,000 | 19,000 | -0.1% | -0.6% | -1.3% | -4.9% |
| Average Weekly Hours | 33.8 | 33.9 | 33.7 (May '05) | 33.8 | 33.7 | 33.7 |
| Average Hourly Earnings | 0.1% | 0.6% | 3.7% | 2.8% | 2.1% | 2.7% |
| Unemployment Rate | 4.6% | 4.7% | 5.1% (May '05) | 5.1% | 5.5% | 6.0% |
by Tom Moeller June 2, 2006
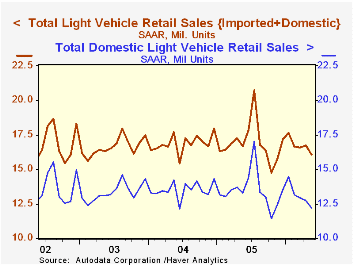
US light vehicle sales during May fell 3.9% m/m to 16.10M units according to the Autodata Corporation. The decline exceeded Consensus expectations for sales of 16.5M units and was to the lowest level since last November.
Overall light truck sales fell 4.9% (-9.6% y/y) last month. Sales of imported light trucks gave back some of the indication of holding up perhaps apparent in April and fell 10.6% m/m (+6.1% y/y). For the fourth month this year, sales of domestic trucks fell sharply. A 3.8% (-11.9% y/y) decline dropped sales to the lowest level since a very weak November. 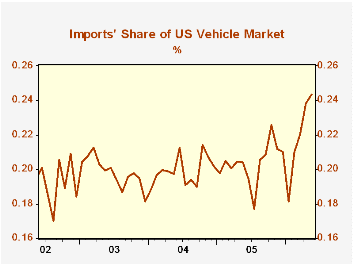
Some relief from the pressure on sales of relatively fuel in-efficient trucks may have been apparent in the modest three cent decline in retail gasoline prices last week to $2.87 per gallon.
Auto sales during May slipped 2.7% (+3.9% y/y) led by a 5.4% (-2.9% y/y) fall in domestic car sales. Sales of imported autos rose 2.9% (20.1% y/y).
Imports' share of the US light vehicle market surged to another record level of 24.4% versus 20.4% during all of last year.
| Light Vehicle Sales (SAAR, Mil. Units) | May | April | Y/Y | 2005 | 2004 | 2003 |
|---|---|---|---|---|---|---|
| Total | 16.10 | 16.74 | -3.5% | 16.92 | 16.87 | 16.63 |
| Autos | 7.79 | 8.00 | 3.9% | 7.65 | 7.49 | 7.62 |
| Trucks | 8.31 | 8.74 | -9.6% | 9.27 | 9.37 | 9.01 |
by Tom Moeller June 2, 2006
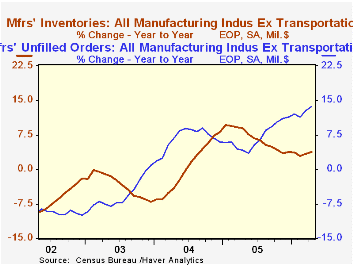
Factory inventories rose 0.7% during April after an upwardly revised 0.9% gain during March. The back to back two-month gains were the strongest since early last year. Historical figures in this MSIO report were very much revised.
Machinery inventories rose 0.6% (4.9% y/y) while inventories of computers & electronic products rose 1.2% (6.3% y/y) after a 2.9% March rise. Inventories of electrical equipment rose 0.6% (6.5% y/y) though inventories of furniture & related products fell 0.2% (5.0% y/y) after the 2.1% jump during March. Primary metals inventories rose 1.2% (1.5% y/y).
Total factory orders gave back half of the prior month's jump with a 1.8% decline. Durable goods orders fell 4.4% and that was little revised from the advance report of a 4.8% slide. Factory orders less transportation rose 0.2% (7.9% y/y).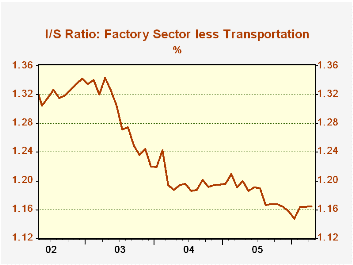
Factory shipments were unchanged following the 1.0% spike in March. Less transportation shipments added 0.6% (6.9% y/y) to the 0.9% March increase. Petroleum shipments rose 3.5% (20.5% y/y). Factory shipments less transportation & petroleum rose 0.3% (5.4% y/y).
Unfilled orders increased another 1.5% due to a 3.7% (74.1% y/y) jump in civilian aircraft. Less the transportation sector altogether backlogs still rose a strong 1.1% (13.7% y/y).
| Factory Survey (NAICS) | April | Mar | Y/Y | 2005 | 2004 | 2003 |
|---|---|---|---|---|---|---|
| Inventories | 0.7% | 0.9% | 3.4% | 4.0% | 6.9% | -7.4% |
| New Orders | -1.8% | 4.0% | 8.7% | 8.5% | 7.5% | 0.9% |
| Shipments | 0.0% | 1.0% | 6.0% | 7.1% | 6.8% | 0.2% |
| Unfilled Orders | 1.5% | 3.0% | 22.8% | 16.3% | 4.5% | -1.0% |
by Carol Stone June 2, 2006
For the last several months, we have been working to expand and reorganize Haver's EMPL database, which consists of the BLS's massive collection of details on the Household Employment Survey. We've recoded the entire database, hopefully making the codes simpler, more intuitive and less like serial numbers. We've added about 1,700 new series, including more detail on employment of various resident Hispanic groups, such as Puerto Ricans. There is also greater detail now on educational status, a topic that receives much attention among the BLS data offerings. The database's menus in DLXVG3 are being restructured so they follow more closely the logic of the tables in Employment and Earnings. This "maintenance" has achieved much in facilitating the use of this enormous database -- now running toward 12,000 series -- and the work continues. Obviously, if you have suggestions, please offer them at data@haver.com.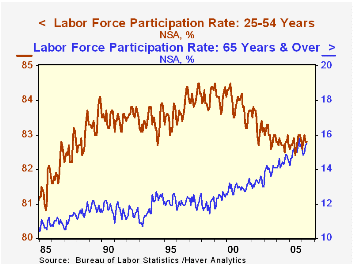
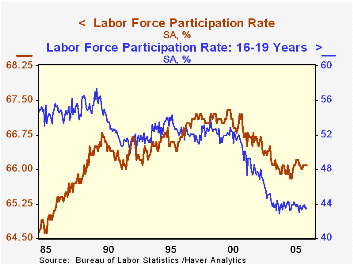
Meantime, we can address numerous questions and topics in the relationships of people to the labor market. We picked something at random to illustrate: labor force participation by age and race, with a highlight on older workers. The first graph shows that in recent years, total labor force participation has decreased somewhat: from 67% of the civilian noninstitutional population in the late 1990s to 66% in 2004 and 2005; it stood at 66.1% in
May, according to the latest data, reported this morning.This modest decline masks widely varying trends among age groups. Teen-agers (16-19 years old) participation has plunged, from 52% at the turn of the decade to just 43.5% last month. This rate has stabilized, however, creeping up from a low of 42.8% in March 2004. So a larger proportion of kids is once again starting to want to work. Other parts of EMPL will tell you how many of kids aged 16-24 are in school, whether they've graduated high school or are perhaps enrolled in college part-time. If they're unemployed, the data will tell you if how many are looking for full- or part-time work.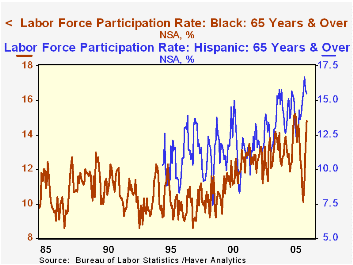
The opposite trend is seen in older workers. For people over age 65, labor force participation is rising; from an average of 12.2% of the population in 1995, the rate reached 15.5% in May. This is also seen in an almost parallel move among white workers in that age group. Other racial and ethnic groups have experienced even larger proportional increases. For blacks and Hispanics, this reflected lower participation in the mid-1990s, just around 10.5%. By now, that for Hispanics is as high as for whites, and blacks are not much below. Since 2000, the BLS has reported separate data for Asian workers. Their participation rates, at 13.7% for the 65 years & older age category, were above the rate for the total labor force in 2000, and while those rates are still relatively high, they also have been more erratic, so it is hard to draw strong conclusions about their labor force status. Nonetheless, an uptrend is clearly identifiable.
Older workers are thus increasingly "economically active", to apply the phrase used in several European countries. This could be simply because they are healthier than before. It could also be that basic living costs necessitate the earning of wage income. But there is one other policy factor that may be important. In April 2000, Congress and the President enacted a law repealing the earnings ceiling on social security benefits. Previously, a recipient's benefits were reduced $1 for every $3 they had in earnings above this ceiling, a clear disincentive to work in more than casual employment. Since then, however, there has been no such rule, and upturns in labor force participation can be marked to roughly the time of the law change. The increased participation even included the months of recession in 2001, a time when people usually pull back from job-hunting.
| % of Noninstitutional Population | May 2006 | Apr 2006 | 2005 | 2004 | 2003 | 2000 | 1995 |
|---|---|---|---|---|---|---|---|
| Total* | 66.1 | 66.1 | 66.0 | 66.0 | 66.2 | 67.1 | 66.6 |
| Age 16-19* | 43.5 | 43.4 | 43.7 | 43.8 | 44.5 | 52.0 | 53.5 |
| Age 25-54* | 82.8 | 82.8 | 82.8 | 82.8 | 83.0 | 84.0 | 83.5 |
| Age 65 & Over | 15.5 | 15.4 | 15.0 | 14.4 | 14.0 | 12.9 | 12.2 |
| White | 15.6 | 15.5 | 15.1 | 14.6 | 14.1 | 13.0 | 12.3 |
| Black | 14.8 | 13.1 | 13.6 | 13.1 | 12.9 | 11.6 | 10.5 |
| Asian | 16.3 | 20.4 | 15.5 | 13.1 | 13.7 | 13.7 | -- |
| Hispanic | 15.5 | 15.8 | 13.9 | 14.5 | 12.8 | 12.2 | 10.5 |

Tom Moeller
AuthorMore in Author Profile »Prior to joining Haver Analytics in 2000, Mr. Moeller worked as the Economist at Chancellor Capital Management from 1985 to 1999. There, he developed comprehensive economic forecasts and interpreted economic data for equity and fixed income portfolio managers. Also at Chancellor, Mr. Moeller worked as an equity analyst and was responsible for researching and rating companies in the economically sensitive automobile and housing industries for investment in Chancellor’s equity portfolio. Prior to joining Chancellor, Mr. Moeller was an Economist at Citibank from 1979 to 1984. He also analyzed pricing behavior in the metals industry for the Council on Wage and Price Stability in Washington, D.C. In 1999, Mr. Moeller received the award for most accurate forecast from the Forecasters' Club of New York. From 1990 to 1992 he was President of the New York Association for Business Economists. Mr. Moeller earned an M.B.A. in Finance from Fordham University, where he graduated in 1987. He holds a Bachelor of Arts in Economics from George Washington University.
More Economy in Brief


